
 Tiếng Việt
Breakout trading is a strategy that enters the market when price breaks key support or resistance levels, aiming to capture strong momentum moves.
Moreover, breakout trading includes key types such as continuation breakouts and reversal breakouts, each reflecting different market conditions and trader intent.
Additionally, breakout strategies focus on entering at the breakout or waiting for a retest, helping traders balance risk and confirmation for more consistent execution.
Furthermore, trading breakouts requires identifying key levels, waiting for confirmation, and managing risk with stop-loss and timing, especially during high volatility sessions.
Finally, indicators like volume, RSI, and MACD are used to confirm breakout strength, reducing false signals and improving trade accuracy.
Mastering breakout trading allows traders to capture explosive market moves with precision. At MBroker, you gain practical knowledge and strategies to trade breakouts effectively with strong confirmation signals.
Breakout trading in financial markets
Breakout trading is an aggressive technical strategy where an investor enters a position the exact millisecond an asset’s price breaches an established horizontal resistance floor or dynamic trendline channel on expanding volume.

Statistically, momentum breakouts precede over 70% of all major microeconomic market trends, making this methodology highly favored by institutional algorithms. By tracking these structural boundary violations, day traders can easily capture high-velocity directional impulses at the absolute birth of a new market cycle.
What is breakout trading and how does it work?
Breakout trading functions by capitalizing on the rapid relocation of market liquidity that occurs when a heavily defended technical barrier is officially compromised. For days or weeks, an asset’s price may bounce back and forth inside a tight consolidation zone, packing resting stop-loss orders and buy-stop entry orders right outside the boundaries. When an influx of large institutional volume pushes price past this threshold, it triggers a massive chain reaction of automated order execution, driving price forward in a rapid, one-sided directional surge.
Recognizing this internal structural mechanism explains why momentum strategies perform exceptionally well when market uncertainty climbs.
Why is breakout trading effective in volatile markets?
Breakout trading is uniquely effective in highly volatile financial environments because structural price expansions expand rapidly under conditions of heavy institutional imbalance. During high-impact economic periods, asset prices do not move in neat, predictable ranges; instead, they build intense structural compression before exploding violently outward into long-term macro trends. Capturing these sudden expansions allows you to align your capital with the dominant side of the market maker’s order book, ensuring you ride maximum volatility rather than getting trapped on the wrong side of it.
Once you appreciate its underlying market power, you must learn to classify the specific setups that manifest across your daily trading feed.
Types of breakout trading setups
The primary types of breakout trading setups include horizontal price pattern extensions, dynamic trendline violations, and historical support or resistance level breaches.
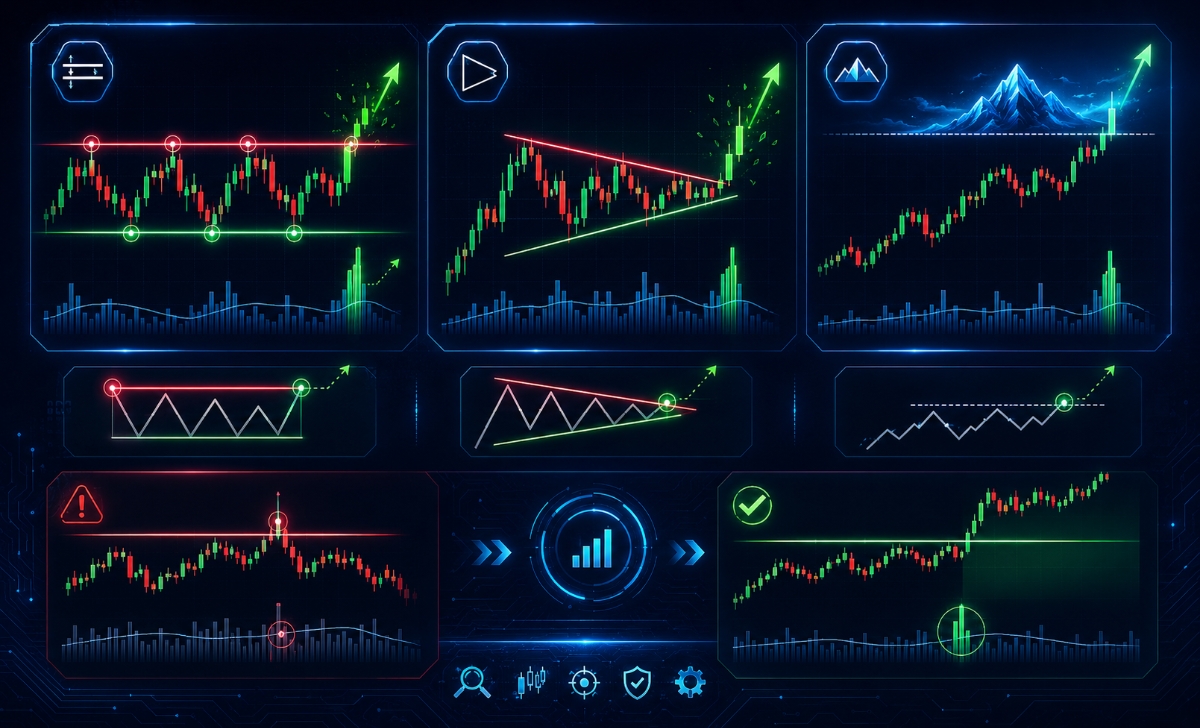
Mapping out your chart geometry with precision is critical, as a valid structural breakout should exhibit an immediate volume expansion that sits at least 50% higher than the preceding 10-period trading average. Mastering these geometric categories allows you to filter through daily market noise and focus your risk capital on highly verified price patterns.
What are the main breakout types in trading?
Technical chartists primarily categorize structural market expansions into three distinct geometric types:
- Horizontal Support/Resistance Breakouts: Price breaches a clear, flat horizontal boundary line where buyers or sellers have repeatedly rejected price in the past.
- Geometric Pattern Breakouts: High-velocity moves that penetrate the outer boundary trendlines of structures like Ascending Triangles, Bull Flags, or Symmetrical Pennants.
- Historical High/Low Breaks: When an asset successfully climbs past its 52-week high or lifetime high, clearing away all overhead resistance and entering a low-drag “blue sky” environment.
While identifying these shapes is simple, protecting your capital requires a deep understanding of why some breaks fail immediately.
How do false breakouts differ from real breakouts?
False breakouts (often called bull or bear traps) occur when price briefly breaches a structural line but lacks the institutional volume required to sustain the move, causing it to reverse back into the range. A real breakout features strong, closing momentum where the candle body settles completely outside the boundary line while being backed by a massive spike in commercial volume. Conversely, a false breakout leaves behind a long candle wick poking through the line, signaling that institutional algorithms simply pushed prices higher to collect retail stop liquidity before changing direction.
To insulate your account from these false entries, you must transition to a rule-based execution strategy.
Breakout trading strategies for consistent execution
A professional breakout trading strategy utilizes either an immediate aggressive breakout entry or a conservative structural retest protocol to ensure entries occur with optimal risk parameters.

Statistically, utilizing structured entry rules can eliminate up to 40% of unforced day trading losses by forcing you to trade only when raw price action confirms institutional support. Integrating these structured rules ensures your entry thresholds remain entirely mechanical and immune to emotional FOMO bias.
What is a basic breakout trading strategy?
A standard breakout execution strategy relies on waiting for a daily or four-hour candle to close decisively outside a multi-test horizontal structure zone. The trader places a buy-stop or sell-stop order slightly past the boundary line to guarantee immediate inclusion when the momentum spike triggers. To protect equity from sudden failure, a strict stop-loss is tucked safely inside the opposite side of the broken consolidation formation, while a target is set using a minimum 1:2 mathematical risk-to-reward ratio.
Depending on your personal risk tolerance, you must choose whether to execute immediately on the break or wait for a second market confirmation.
Should traders use breakout or retest strategy?
Choosing between the direct breakout or the retest strategy depends entirely on your system’s design and execution environment:
- The Direct Breakout Strategy: Captures 100% of high-momentum moves because you enter immediately upon the boundary breach, but exposes your account to a higher overall historical percentage of false breakouts.
- The Retest Strategy: Requires price to break out, reverse back to test the broken line as new support, and bounce off it before you enter. This drastically reduces false entries, but means you will completely miss high-velocity “runaway” trends that never look back.
Whichever path fits your trading profile, executing the trade correctly requires following a clean, step-by-step institutional blueprint.
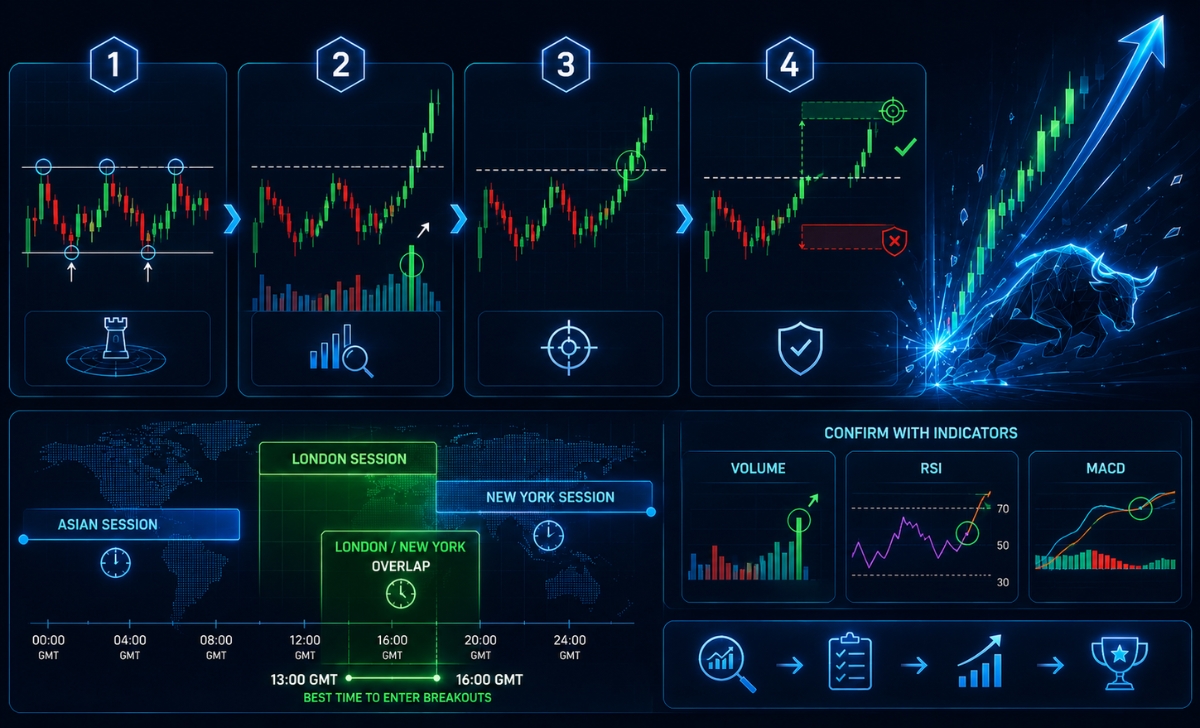
How to trade breakout setups step by step?
Trading breakout setups step by step requires executing a strict validation checklist that governs your exact entry trigger, protective stop placement, and structural profit extraction.
Professional traders never guess their parameters; they wait for the market to print its definitive structural coordinates before deploying any hard capital. When these structured application rules are executed within premium institutional environments like the one featured on the XM Guide, day traders can easily capitalize on massive market moves while keeping their execution costs completely optimized.
What are the steps to trade a breakout effectively?
To execute a professional breakout position with flawless technical precision, enforce this 4-step structural framework:
- Step 1: Isolate a Major Key Level: Identify a highly visible horizontal resistance or support floor that has successfully rejected price at least three times on your chart.
- Step 2: Verify Volume Expansion: Monitor your data feed; ensure that the breaking candle features a prominent volume surge to prove institutional market makers are backing the move.
- Step 3: Execute at the Candle Close: Enter your position the exact second the breaking candle closes completely outside the pattern boundary to ensure the break is authentic.
- Step 4: Manage Your Risk Matrix: Position your protective stop-loss behind the middle of the consolidation structure and set your take-profit target using a measured structural height projection.
To secure the highest probability of step-two volume validation, you must schedule your execution routine around peak international market hours.
When is the best time to enter a breakout trade?
The absolute best time to enter a breakout trade is during the London and New York session overlap (13:00 GMT to 16:00 GMT), when global interbank liquidity and transaction volumes reach their daily peak. During this highly active 3-hour window, major central banks and hedge funds actively deploy capital, providing the genuine momentum needed to sustain technical breakouts. Attempting to trade breakouts during the quiet Asian session often leads to heavy losses, as low volume causes prices to frequently stall out and trap retail accounts in messy, range-bound whipsaws.
To completely bulletproof your strategy against these low-volume traps, you should back your price action analysis with algorithmic indicator confirmation.
Indicators confirmation for breakout trading
Indicators confirmation for breakout trading provides an objective mathematical filter that validates whether an accelerating price break possesses genuine institutional volume or hidden trend exhaustion.

Technical indicators remove dangerous human optimism from your charts, forcing you to verify that an entry aligns perfectly with momentum indicators and volume oscillators. Sourcing your indicator data from pristine, unmanipulated charts—such as the premium feeds highlighted on the MBroker – ensures your technical indicators calculate their mathematical readouts with absolute real-time accuracy.
Which indicators confirm breakout signals effectively?
To eliminate false signals and confirm true momentum, integrate these three powerful technical indicators into your workspace:
- The Average Directional Index (ADX): A non-directional trend strength oscillator; an ADX reading above 25 confirms that the market is entering a powerful trending state capable of sustaining a breakout.
- Bollinger Bands: A volatility indicator; when price actively forces the upper or lower Bollinger Bands to expand outward (known as “walking the bands”), it confirms an authentic structural breakout is underway.
- The Relative Strength Index (RSI): A classic momentum tool; ensures the RSI has not crossed into deeply overbought (<70) or oversold (<30) territory before the break, as an exhausted market cannot sustain a breakout.
By linking these individual indicator readouts into a unified execution checklist, you maximize your strategy’s statistical edge.
How to combine indicators with breakout trading?
To build an institutional-grade confirmation matrix, combine your geometric price patterns with an explicit multi-indicator rule filter. For a bullish breakout setup, your entry should only trigger if price closes above horizontal resistance, while the ADX simultaneously climbs above 25, and the volume indicator records a clear breakout spike. By cementing this multi-layered confirmation system into your routine and utilizing the real-time technical updates found on the MBroker, you ensure your portfolio remains protected while executing high-velocity market setups with absolute precision.
In short, Breakout Trading is a powerful methodology for capturing high-velocity trends at their exact moment of inception on the interbank market. By classifying your geometric setups, waiting for candle closes outside boundary lines, and utilizing indicators like the ADX and Bollinger Bands to confirm volume expansion, you can easily eliminate costly execution guesswork.

Thoren Vextal is a specialist in XM trading guides, offering practical insights and real-market experience to help traders improve their strategies and trading performance. Email: [email protected]