
 Tiếng Việt
Forex Technical Analysis
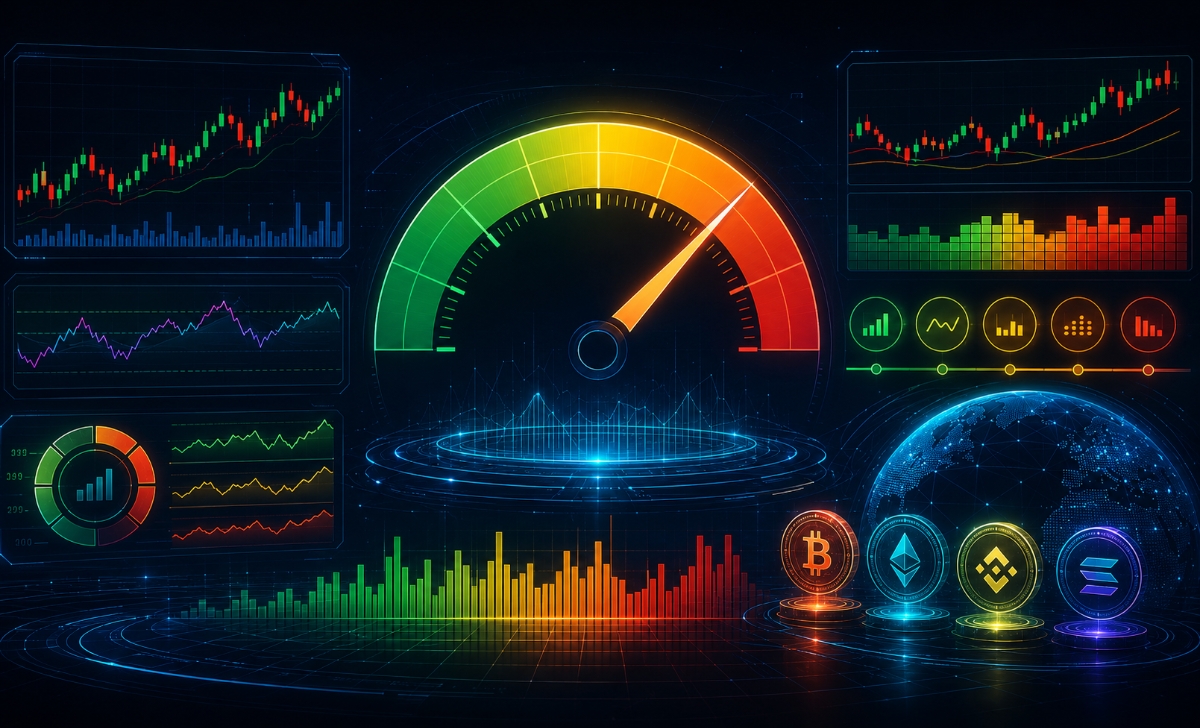
Forex Technical Analysis is the method traders use to analyze price charts and historical data to predict market direction. It helps traders make objective trading decisions based on data instead of emotions.
Indicators in Forex Technical Analysis are tools that help traders measure momentum, trend, and volatility. Using indicators correctly allows you to identify entry and exit points more accurately.
Identifying Market Trends means recognizing whether the market is moving up, down, or sideways based on price structure and trendlines. This helps traders follow the trend and avoid false trading signals.
What Is Forex Technical Analysis?

Forex Technical Analysis is the process of evaluating price charts, historical data, and patterns to forecast future market movements. Instead of relying on news or economic reports, traders focus on price action and technical signals.
This method is widely used in forex trading strategies, especially for short-term and intraday trading. By analyzing charts, traders can identify repeating patterns and make data-driven decisions.
Technical analysis is built on three core principles:
- Price reflects all market information
- Prices move in trends
- Historical patterns tend to repeat
Understanding these principles creates a strong foundation for using technical tools effectively. To see how this works in practice, let’s explore real trading applications.
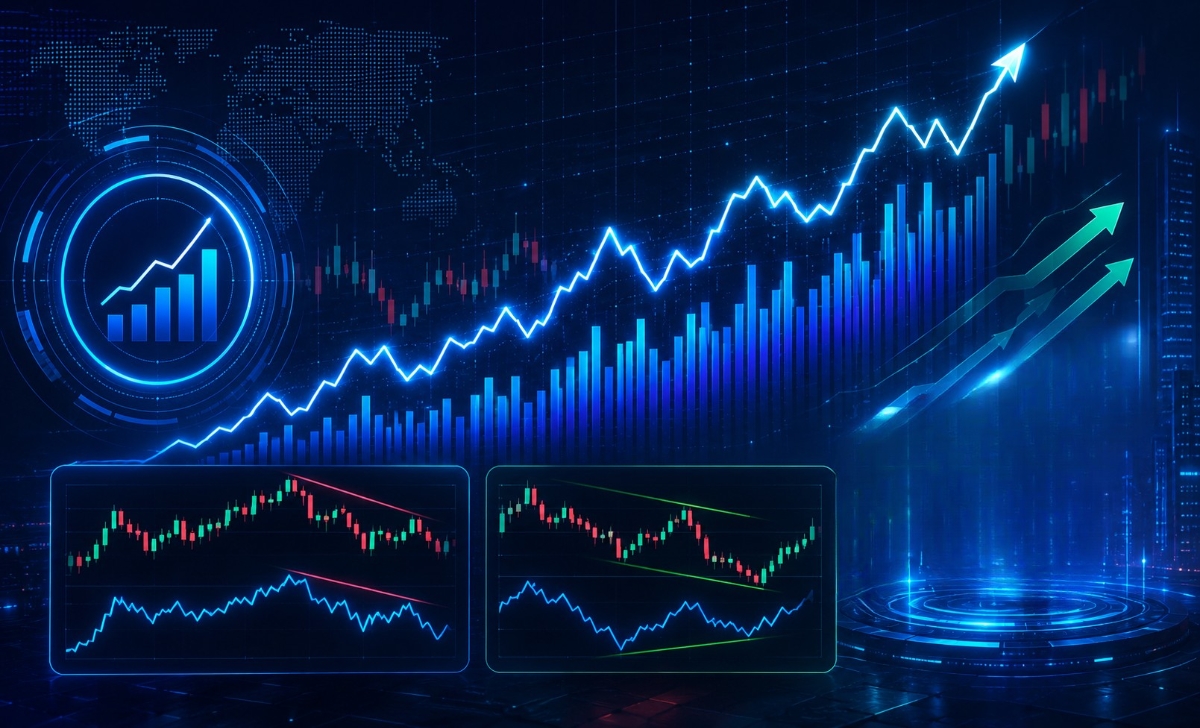
How Forex Technical Analysis Works in Real Trading
In real trading environments, technical analysis is applied through charting platforms like MT4 or MT5. Traders use indicators, trendlines, and candlestick patterns to determine entry and exit points.
For example:
- Identifying support and resistance levels
- Using moving averages to confirm trends
- Applying RSI to detect overbought or oversold conditions
These methods are commonly integrated into XM trading to improve timing and reduce emotional decisions.
Benefits of Using Technical Analysis in Forex Trading
Using technical analysis provides several advantages:
- Better entry and exit timing
- Objective decision-making based on data
- Adaptability across different markets and timeframes
- Compatibility with automated trading systems
Because of these benefits, technical analysis is often combined with risk management techniques and trading plans. The next step is understanding the tools that power this method—forex indicators.
What Are Forex Indicators?
Forex indicators are essential tools used to interpret price data and market conditions. They are mathematical calculations that help traders analyze trends, momentum, and volatility.
Indicators are widely used in both beginner and advanced trading systems. However, choosing the right indicators is crucial for accurate analysis.
Types of Forex Indicators Every Trader Should Know
There are four main types of indicators every trader should understand:
- Trend indicators: Moving Average, MACD
- Momentum indicators: RSI, Stochastic
- Volatility indicators: Bollinger Bands
- Volume indicators: Tick Volume
Each type plays a different role. For instance, trend indicators show direction, while momentum indicators help confirm strength.
These indicators are often used together in technical trading systems to improve reliability.
How to Combine Indicators for Better Accuracy
Combining indicators is a common technique to reduce false signals. Instead of relying on a single tool, traders use multiple indicators for confirmation.
A simple combination strategy:
- Moving Average → identify trend
- RSI → confirm momentum
- Bollinger Bands → measure volatility
This approach helps traders build a more structured system. However, overloading charts with too many indicators can reduce clarity, so simplicity is key.
Once you understand indicators, the next step is applying them to identify market trends.
How to Identify Market Trends in Forex Trading?
Market trends define the overall direction of price movement. Trading with the trend is one of the most effective ways to increase success rates.
There are three main trend types:
- Uptrend: Higher highs and higher lows
- Downtrend: Lower highs and lower lows
- Sideways: Price moves within a range
Recognizing these patterns is essential for applying any forex technical analysis strategy effectively.
Key Methods to Recognize Trends in Forex Markets
Traders use several methods to identify trends:
- Trendlines: Visual support and resistance
- Moving averages: Smooth price data
- Price structure analysis: Observe highs and lows
- Indicators like MACD: Confirm trend direction
Combining these methods improves accuracy and helps traders avoid false signals.
Common Mistakes When Identifying Market Trends
Many traders make avoidable mistakes when analyzing trends:
- Ignoring higher timeframe confirmation
- Entering trades too early or too late
- Misreading sideways markets as trends
- Over-relying on indicators without price action
Avoiding these mistakes is critical for improving performance. With proper trend identification, traders can begin to master technical analysis.
How to Master Forex Technical Analysis for Consistent Trading Results
Mastering Forex Technical Analysis requires continuous practice and refinement. It is not just about understanding indicators but applying them consistently in real market conditions.
To improve your results:
- Practice using demo accounts
- Focus on a small set of reliable indicators
- Build a clear trading plan
- Track performance with a trading journal
Over time, combining technical analysis with discipline and risk management will help you develop a consistent trading edge. Forex Technical Analysis is most effective when integrated into a complete trading system. By combining indicators, trend analysis, and risk management, traders can improve decision-making and long-term performance.
To get started, focus on mastering the basics, test your strategies, and continuously refine your approach. This is the key to building a sustainable and profitable trading journey.
Additionally, you can refer to the detailed XM guide, which specifies trading methods and how to execute orders correctly, ensuring fast and secure transactions.

Risk Reward Ratio: Meaning, How to Calculate, Forex Strategy
Risk Reward Ratio is the ratio between potential profit and potential loss, typically ranging from...
Fear and Greed Index: Market Sentiment, Crypto Trends, Trading Signals
The Fear and Greed Index measures market sentiment from 0–100, where low values signal fear...

Volume Weighted Average Price: VWAP Strategy and Trading Guide
Volume Weighted Average Price (VWAP) is an intraday benchmark that reflects the average traded price...

Doji Candlestick: Price Indecision, Reversal Signals and Strategy
Doji candlestick is a pattern where the open and close prices are nearly equal, indicating...
OnBalance Volume: OBV Indicator, Divergence and Trend Insight
OnBalance Volume (OBV) is a volume-based indicator that measures cumulative buying and selling pressure to...
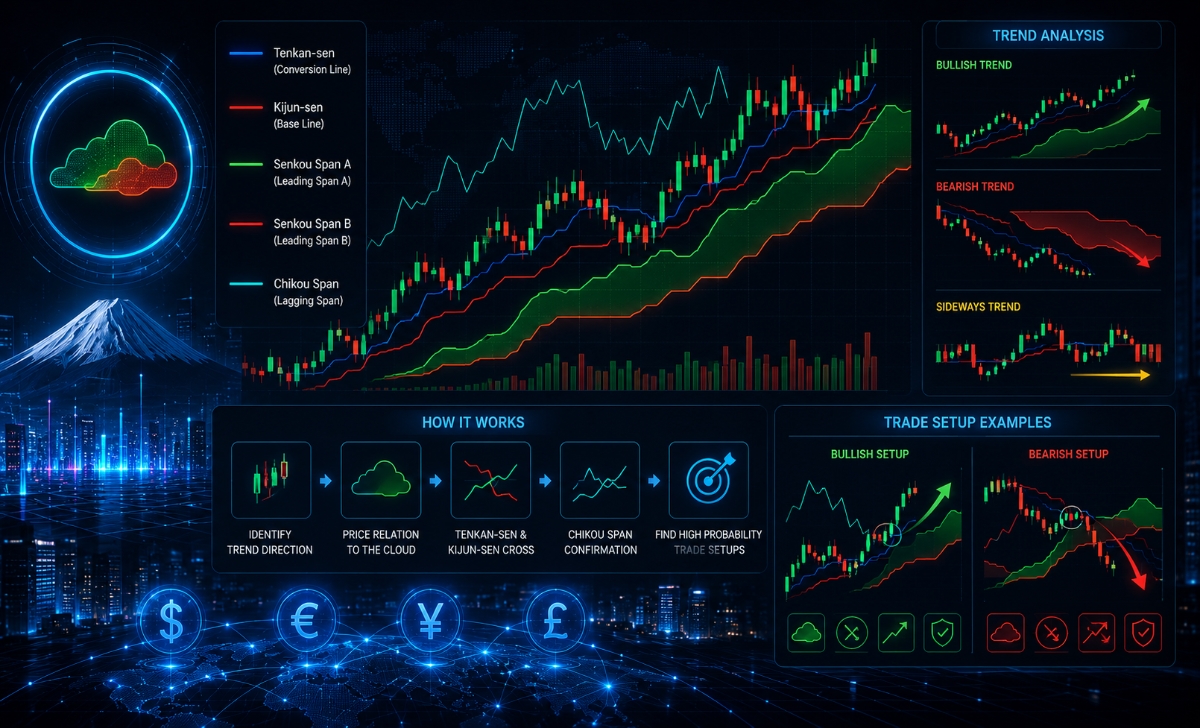
Ichimoku Indicator: How It Works, Trend Analysis and Trade Setup
Ichimoku Indicator is an all-in-one system that identifies trend, momentum, and support/resistance in a single...
Reversal Patterns: Market Reversal, Forex Trading and Indicators
Reversal patterns are chart formations that signal a potential change in trend direction, helping traders...
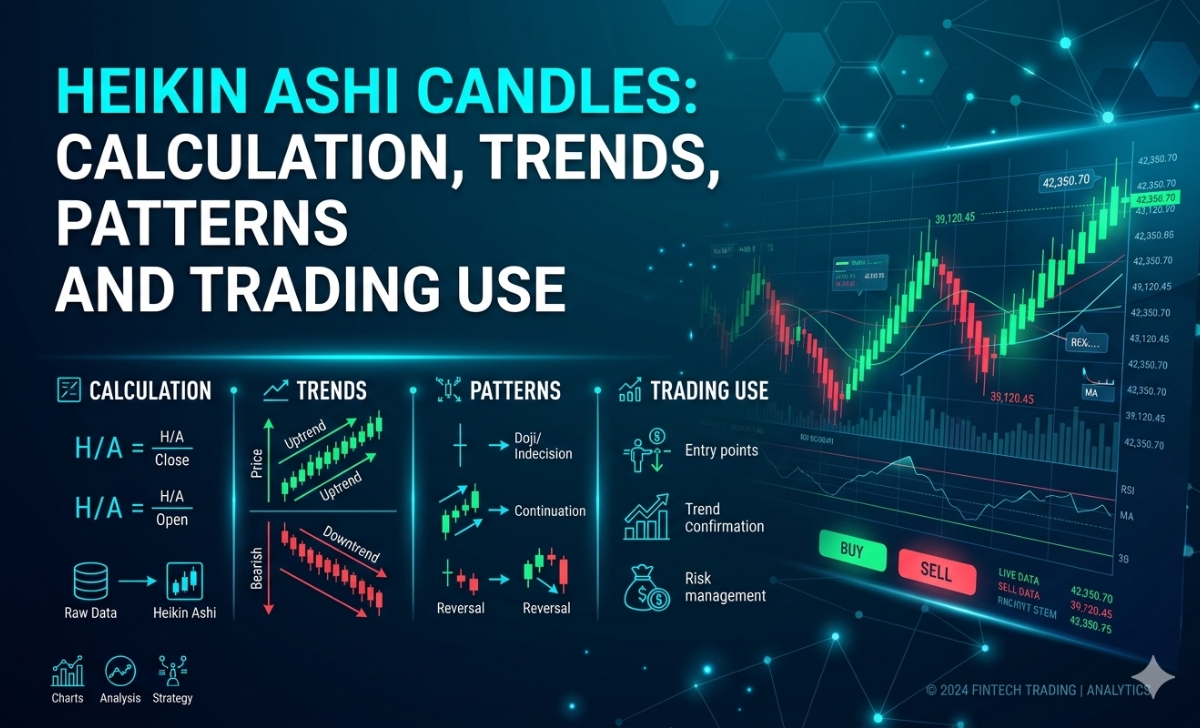
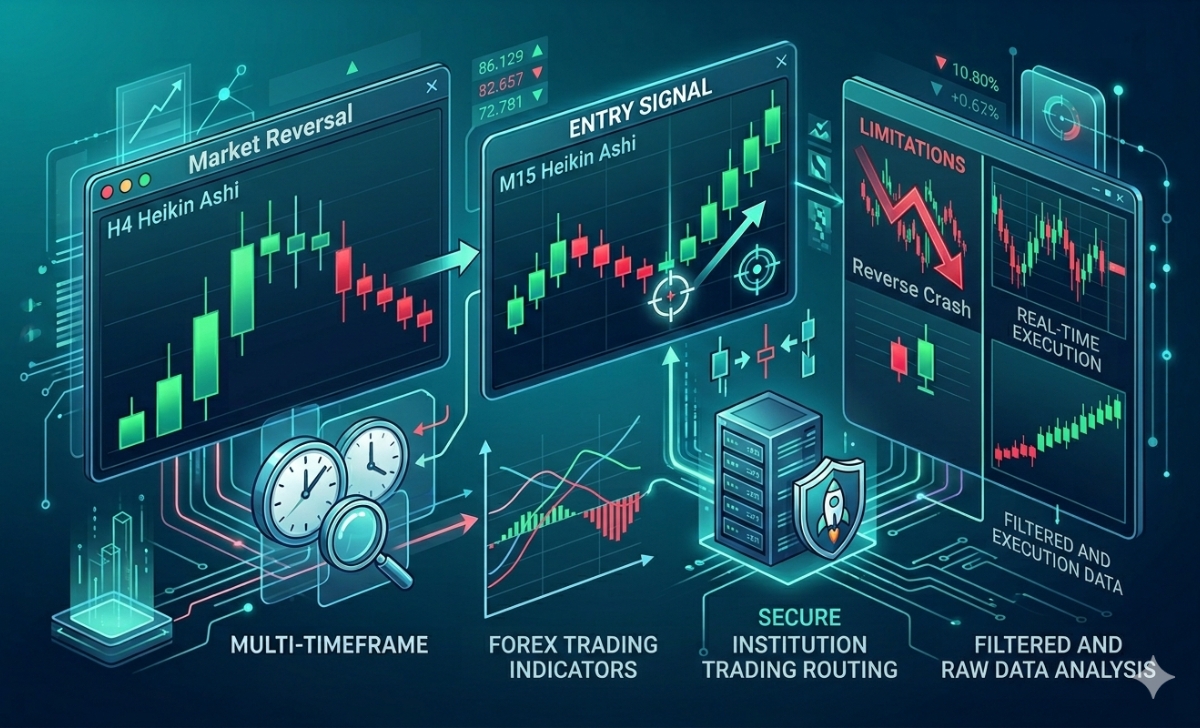
Heikin Ashi Candles: Calculation, Trends, Patterns and Trading Use
Heikin Ashi candles are modified candlesticks that smooth price data to highlight trends more clearly,...
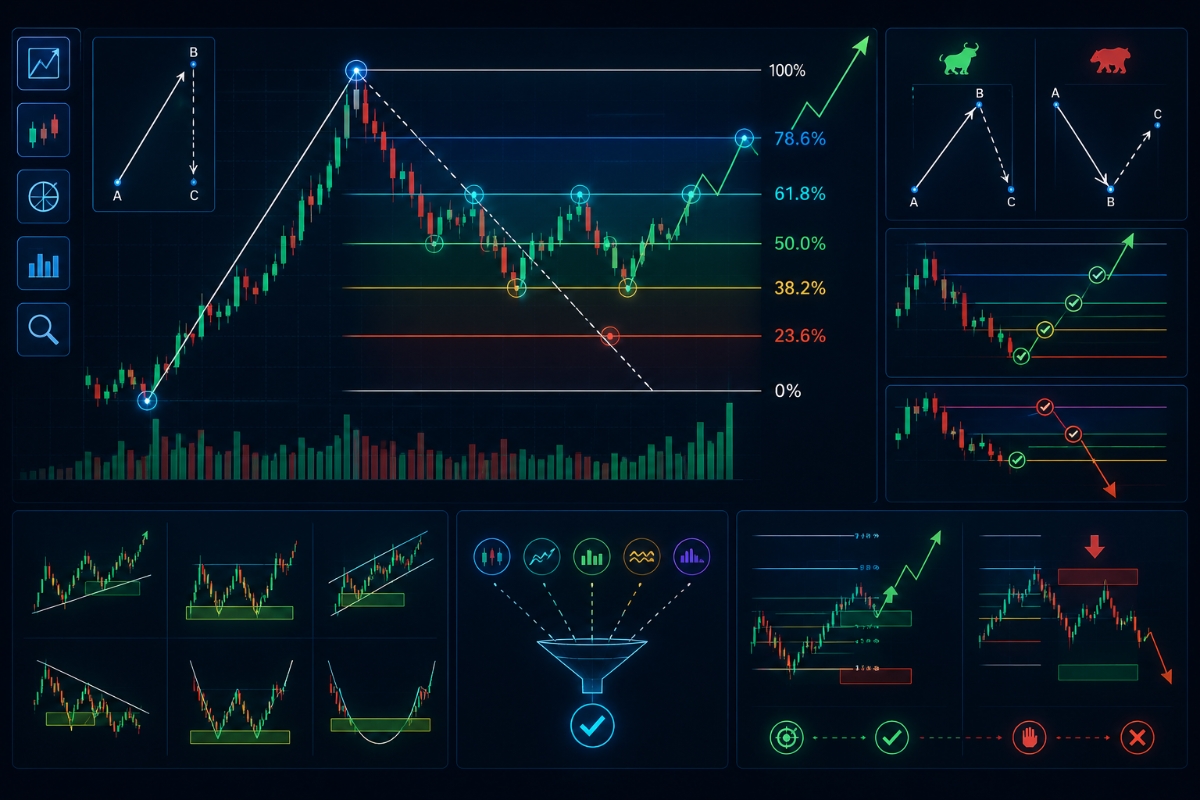
Fibonacci Retracement: Key Levels, Chart Setup and Trading Use
Fibonacci retracement is a technical tool that identifies key pullback levels (23.6%, 38.2%, 50%, 61.8%,...
Volume Analysis: Market Insight, Forex Application, Types, Volume Indicators
Volume analysis delivers market insight, forex application, key types, and core indicators, helping traders confirm...