
 Tiếng Việt
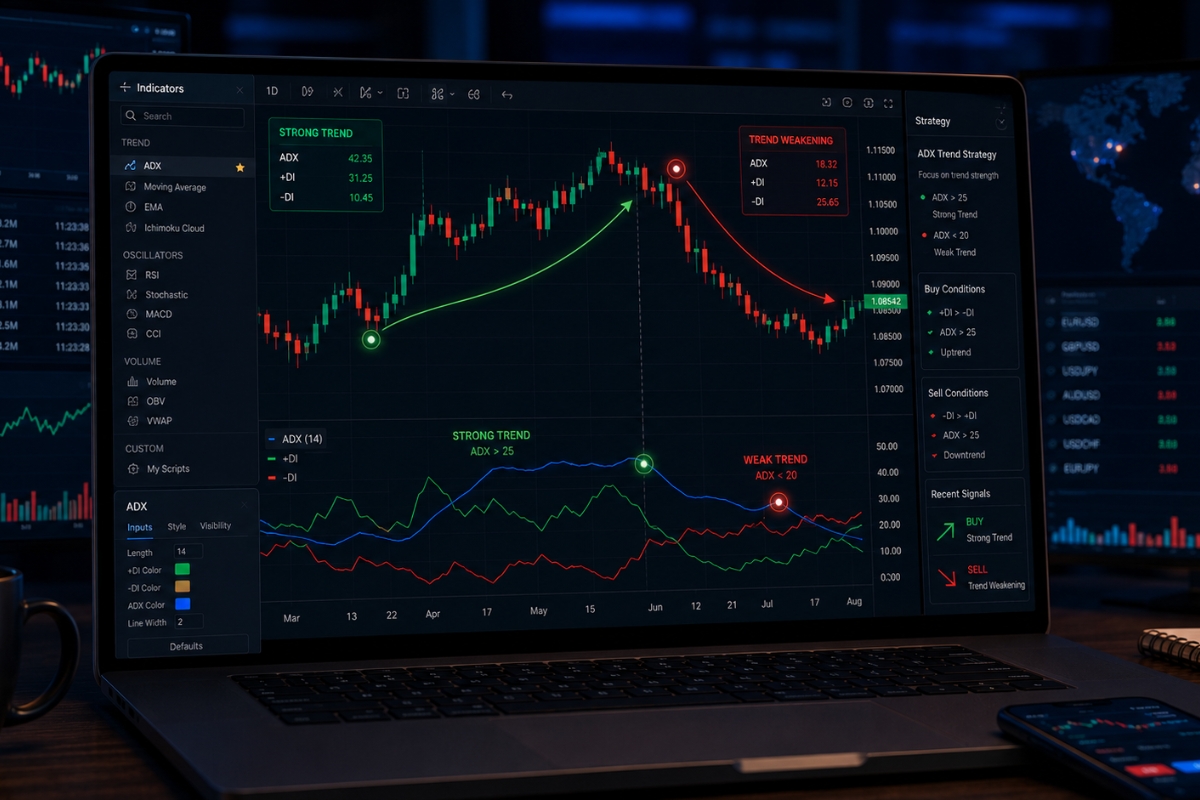
ADX Indicator Trading measures trend strength on a scale from 0–100, where values above 25 indicate a strong trend.
Trend strength is determined by the ADX value regardless of price direction, meaning ADX shows whether the market is strong or weak, not whether it is bullish or bearish.
ADX signals include ADX above 25 for strong trends and +DI/-DI crossovers to identify directions, helping traders find clearer entry points.
The most common ADX setting is period 14 on MT4, MT5, and TradingView, providing a balance between sensitivity and accuracy in trend analysis.
An effective ADX strategy combines ADX above 25 with +DI/-DI signals to trade in the trend direction, while avoiding trades when ADX is below 20 (sideways market).
In financial trading, identifying whether a trend is strong or weak is crucial for making accurate decisions. ADX Indicator Trading helps measure trend strength, allowing traders to build more effective strategies. If you want to fully understand how to use ADX from basic to advanced, explore the Forex Trading Strategy category for deeper insights.
ADX indicator trading and trend strength measurement
ADX indicator trading focuses entirely on quantifying the velocity and momentum of a market trend, completely independent of its actual direction.

Developed by J. Welles Wilder, the index fluctuates on a scale from 0 to 100, where any reading above 25 indicates a strong, tradable trend, while values below 20 warn of a stagnant, ranging market environment. Statistically, filter-based trading systems that utilize this metric can eliminate up to 60% of false entries by keeping traders out of low-liquidity market whipsaws.
To successfully apply this momentum metric to your daily routine, you must first master what occurs under the hood and understand why it has become a staple tool for global macro investors.
What does ADX indicator measure in trading?
The ADX measures the absolute strength of a trend over a specific period, typically 14 days, by analyzing the expansion or contraction of price ranges. It does not indicate whether the market is bullish or bearish; instead, a rising line means the current trend (up or down) is gaining significant power, while a falling line signals that the trend is losing momentum. This unique mathematical approach makes it a “pure volume-momentum proxy” that helps you identify when a market is transitioning from a quiet accumulation phase into an explosive distribution phase.
This pure measurement of velocity is precisely why modern digital asset and currency traders rely so heavily on the system.
Why is ADX important in forex and crypto trading?
The index is critically important because both Forex and Cryptocurrency markets are highly prone to sudden, unexpected shifts between intense volatility and complete stagnation.
- In Forex: Currencies spend roughly 70% to 80% of their time in sideways ranges; the index alerts you exactly when the remaining 20% of explosive trend movement is occurring.
- In Crypto: Digital assets suffer from intense retail momentum swings. The index validates whether a breakout is backed by real institutional volume or just speculative noise. For clients operating through MBroker, deploying this indicator ensures that you are utilizing your capital only when the market possesses the directional velocity required to reach your profit targets.
Once you know how trend strength is calculated, the next phase is learning how to translate the indicator’s movements into actionable entry and exit triggers.
Signals and interpretation ADX indicator
Interpreting the ADX Indicator requires looking beyond the main index line and analyzing its interaction with its two component sub-indicators: the Positive Directional Indicator (+DI) and the Negative Directional Indicator (-DI).
Valid trading signals are generated when a significant directional crossover occurs simultaneously with the main index line climbing into a high-velocity zone (above 25). This combined reading provides a highly reliable snapshot of market sentiment, confirming who is winning the war between the bulls and the bears.
What are the key ADX signals in trading?
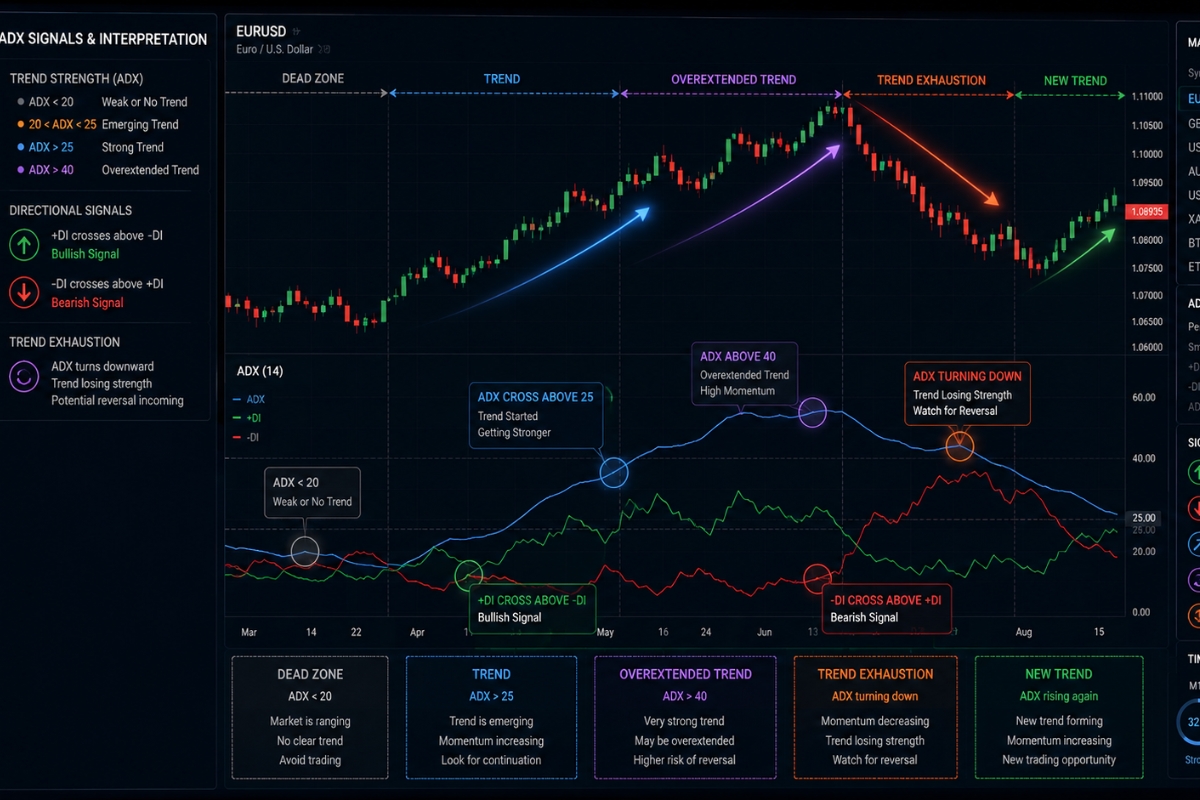
The primary signals generated by this technical suite revolve around specific milestones on the 0-100 grid:
- The Trend Trigger (Cross Above 25): Confirms that the XM market hours have left their range and entered a high-momentum state.
- The Overextended Signal (Cross Above 40): Warns that the trend is becoming unsustainably strong and a temporary retracement or reversal is imminent.
- The Counter-Trend Reversal (Peak and Turn Down): When the line peaks above 40 and turns downward, it signals the structural exhaustion of the dominant trend.
To turn these general strength signals into precise long or short entry coordinates, we must integrate the directional elements.
How to combine ADX with directional indicators?
Combining the main strength line with the directional indicators (+DI and -DI) creates a complete, standalone trading system.
- Bullish Alignment: When the +DI crosses above the -DI while the main line is actively rising above 25, it signals a high-probability Buy entry.
- Bearish Alignment: When the -DI crosses above the +DI while the main line is climbing past 25, it confirms a high-probability Short/Sell configuration.
- The Dead Zone: If the +DI and -DI are constantly intertwining while the main line sits below 20, the system signals a total market freeze, telling you to stand aside.
With signal mechanics fully understood, the next operational objective is setting up your software parameters correctly to match live market conditions.
ADX indicator settings and platform usage
Configuring the ADX Indicator parameters correctly is a fundamental step that directly determines the sensitivity and accuracy of your chart analysis.
The software can be loaded effortlessly onto all major retail and institutional charting platforms, including TradingView and MetaTrader 4 (MT4). While the default settings are mathematically sound for standard daily intervals, optimizing these numbers to match your specific asset class and strategy is essential for minimizing lagging data distortions.
Discover the ideal configuration rules used by institutional desks and learn how to implement them across modern charting terminals.
What are the best ADX settings for trading?
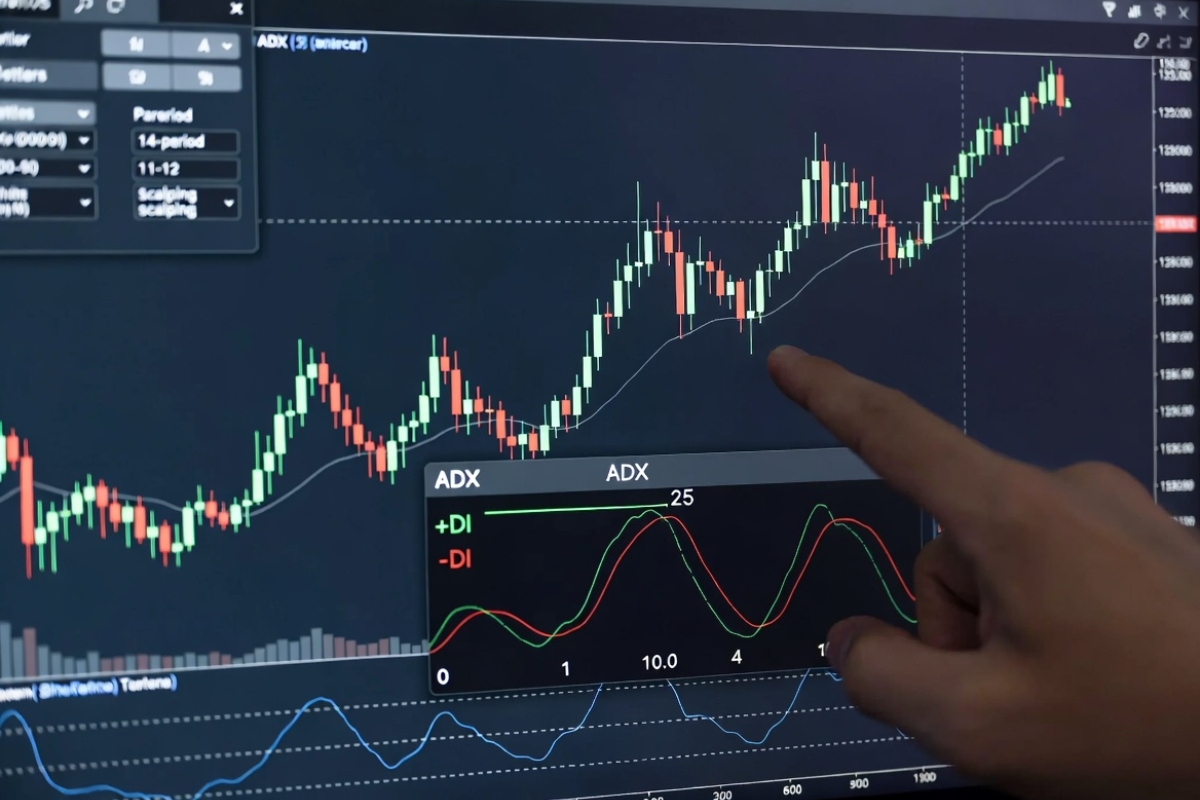
The undisputed industry standard for the index is a 14-period lookback with a smooth Wilder’s Moving Average filter applied to the data.
- For Swing Traders (Daily/4-Hour Charts): Keep the default 14-period setting, as it offers the cleanest balance between raw speed and reliable structural confirmation.
- For Intraday Scalpers (15-Minute/5-Minute Charts): Shorten the lookback to an 11 or 12-period setting to reduce latency and capture rapidly developing micro-trends.
- The Threshold Line: Always manually plot a horizontal reference line at the 25 level on your sub-window to serve as an immutable visual separator for trend validation.
Once you have chosen your operational periods, activating the indicator on your favorite platform involves a simple technical process.
How to use ADX indicator on TradingView and MT4?
Activating and customizing the system varies slightly depending on your chosen interface architecture:
- On TradingView: Navigate to the “Indicators” tab, search for “Average Directional Index” or “DMI” (Directional Movement Index), and add it to your layout. You can adjust the line colors and thickness in the settings menu to clearly isolate the +DI and -DI components.
- On MetaTrader 4 (MT4): Go to the “Insert” menu, select “Indicators,” choose “Trend,” and click on “Average Directional Movement Index.” Ensure the input parameters reflect your 14-period preference before saving. Many professional technical desks, such as those audited by MBroker, prefer the MT5 or MT4 execution environment due to its lightning-fast data synchronization speeds during high-impact news.
Now that your platform is fully calibrated, you are ready to execute a rule-based, institutional-grade trading strategy.
ADX indicator trading strategy and application
A disciplined ADX Indicator trading strategy eliminates human emotion by converting raw market geometry into a strict series of binary execution steps.
This strategy excels because it forces you to participate only in high-velocity market environments where prices move rapidly toward your target zones. By matching trend validation with strict structural stop placements, you can maximize your win rate while maintaining an exceptional risk-to-reward ratio.
What is a step-by-step ADX trading strategy?
To effectively apply ADX in real trading, understanding the concept alone is not enough—you need a clear, actionable process. That’s why building a step-by-step ADX trading strategy is essential, helping you identify trend strength, confirm direction, and execute trades with better precision.
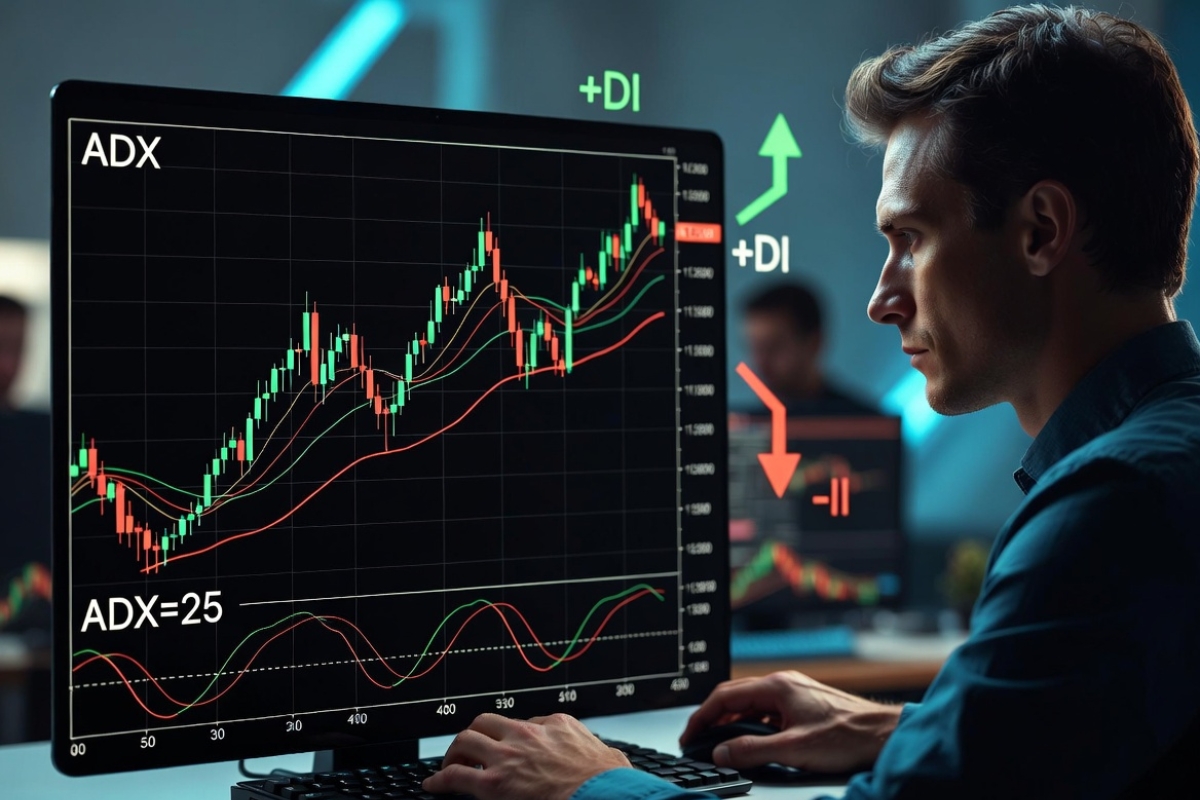
- Step 1: Identify ADX above 25 (strong trend): Scan your instrument list and verify that the main line has successfully breached and closed above the 25 threshold line, confirming an active momentum market.
- Step 2: Confirm direction using +DI and -DI: Look at the directional sub-lines. If +DI is on top, you are looking exclusively for buy setups; if -DI is on top, your focus shifts entirely to short positions.
- Step 3: Enter trade in trend direction: Execute your trade order at the close of the validating candle that pushes the index line over 25, or wait for a minor price retest of a short-term moving average.
- Step 4: Set stop loss based on structure: Place your protective Stop Loss safely below the recent swing low (for longs) or right above the recent swing high (for short positions).
- Step 5: Manage trade using trend continuation: Hold the position as long as the main line remains elevated or continues to climb. Prepare to manually exit or tighten your trailing stops the moment the line flattens out and turns downward from a peak above 40.
While this mechanical blueprint is incredibly powerful, every technical tool has a weakness that you must prepare for.
When should traders avoid using ADX?
Traders must completely avoid using the index during a low-volume consolidating market or immediately ahead of major, high-impact fundamental news releases (like NFP or CPI data).
When an asset is locked inside a tight horizontal trading range, the +DI and -DI lines will generate a cascade of false crossover signals while the main line drifts lower. Attempting to trade these micro-crosses will quickly result in account erosion through commissions and spread costs, making patience mandatory until a clean breakout occurs.
Recognizing these environmental hazards leads us directly to our final module: quantifying the risk parameters and structural limitations of the tool.
Risk and limitations of ADX indicator in trading
Managing the risk profiles and inherent limitations of the ADX Indicator is what separates long-term profitable professionals from struggling amateurs.

Like all lagging technical indicators, the index derives its calculations from past price action, meaning it cannot predict a market reversal before it begins to manifest on the tape. Acknowledge these technical blind spots and back them up with strict capital preservation metrics to ensure that a sudden trend collapse never endangers your overall account solvency.
What are the limitations of the ADX indicator?
The primary limitation of the index is its inherent time lag, which is caused by the smoothing mathematical formulas used to compile directional movement data. By the time the main line climbs above 25 to officially confirm a strong trend, a significant portion of the primary market move may have already occurred. Additionally, the indicator offers no structural price targets, meaning it can tell you that a trend is incredibly powerful, but it cannot calculate the exact horizontal resistance zone where that trend will ultimately hit an unbreakable wall.
To mitigate these computational blind spots, you must wrap the tool in a strict, protective risk management envelope.
How to manage risk when using ADX?
To insulate your portfolio from sudden lagging signals, enforce these three institutional risk management standards:
- Strict Capital Caps: Limit your total risk exposure to a maximum of 1% to 2% of your aggregate account equity on any individual signal layout.
- Multi-Timeframe Filtering: Always cross-reference your lower-tier intraday signals with the Daily trend index to ensure you are never trading against the primary institutional macro trend.
- Unify with External Tools: Pair your entries with pure price action structures, volume indicators, or the real-time research feeds provided on the MBroker homepage to add an extra layer of structural validation before committing real capital.
In conclusion, the ADX Indicator remains an irreplaceable asset for modern technical analysts due to its unmatched ability to isolate raw trend strength from market noise. By configuring your parameters correctly, waiting for structural crossovers above the 25 threshold, and enforcing strict risk management, you can trade with a substantial edge.

Thoren Vextal is a specialist in XM trading guides, offering practical insights and real-market experience to help traders improve their strategies and trading performance. Email: [email protected]