
 Tiếng Việt
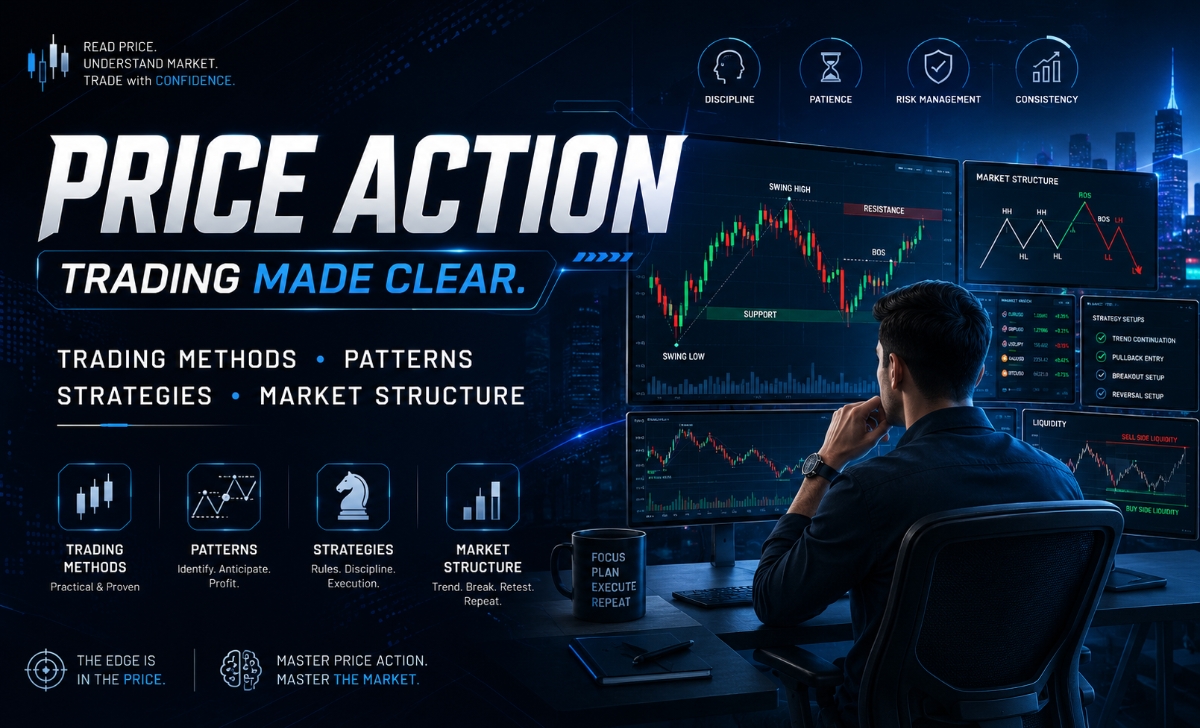
Price action is the direct analysis of raw price movement without indicators, allowing traders to read market behavior through candlesticks, structure, and key levels.
Moreover, professional trading methods in price action focus on key levels, breakouts, and pullbacks, adapting to different market conditions such as trends or ranges.
Additionally, price action patterns like pin bars, engulfing candles, and inside bars provide high-probability signals, helping traders identify reversals and continuations.
Furthermore, price action strategies combine patterns, support/resistance, and risk management, creating a structured approach for consistent trade execution.
Finally, market structure defines trends through higher highs and lower lows, enabling traders to align entries with the overall market direction.
Mastering price action is essential to understand real market behavior and improve trade timing. At MBroker, traders can explore this approach in depth through the XM Guide, where practical methods, patterns, and strategies are applied to real trading scenarios for better execution and consistency.
What is price action?
Price action is a pure technical analysis methodology that relies exclusively on the historical movement of an asset’s price chart to determine future trend direction and execution points, entirely bypassing lagging mathematical indicators.

Over 70% of institutional proprietary traders utilize raw price data as their primary analytical foundation because price is the only variable that updates with zero computational delay. Observing the raw print of the candles enables retail investors to interpret immediate shifts in global supply and demand mechanics, facilitating highly precise entry and exit executions before secondary indicators can even calculate a line change.
How does price action reflect market behavior?
Raw price action serves as a real-time mirror of aggregate market psychology, tracking the collective fear, greed, and institutional conviction of all participating buyers and sellers globally. Each individual candlestick represents a completed battle over asset valuation; for instance, a long lower wick proves that institutional buyers aggressively stepped in to absorb heavy selling pressure at a specific price floor. Deciphering these organic price footprints provides day traders with an unmanipulated view of raw order flow, exposing the true intentions of big money before public economic reports are officially released.
Recognizing this clean behavioral connection explains why the world’s most successful market technicians completely discard traditional lagging setups.
Why do professional traders prefer price action?
Professional desk traders favor raw price action because it completely eliminates the computational lag, chart clutter, and conflicting signals inherent in mathematical indicators like moving averages or MACD. By focusing strictly on native price delivery, professionals can capture institutional breakouts and trend reversals at the absolute earliest possible moment, compressing their stop-loss requirements to just a few pips. This structural edge dramatically scales up their net risk-to-reward ratios, ensuring their portfolios remain highly optimized across all asset cycles.
Armed with an understanding of this core philosophy, you must now master the specific execution methodologies used to navigate daily market environments.
Trading methods for price action used by professionals
The trading methods for price action used by professionals center entirely on identifying clean breakout continuations, executing pullbacks at structural support/resistance zones, and capitalizing on institutional liquidity sweeps.

Statistically, a rule-based execution methodology that waits for clear structural validation yields a significantly higher probability of success than trying to guess a market top or bottom blindly. Implementing these standardized professional frameworks protects your capital from erratic intra-day price noise, keeping your trading operations strictly aligned with high-volume banking algorithms.
What are the main price action trading methods?
The global institutional landscape relies on three primary, systematic execution methodologies:
- The Support and Resistance Pullback Method: Buying or selling an asset the exact moment it retraces back to a previously broken horizontal structure zone, capturing a highly discounted entry price.
- The Breakout Continuation Method: Placing buy-stop or sell-stop orders just beyond an established consolidation boundary, capturing rapid momentum as institutional order blocks drive prices to new tiers.
- The False Breakout (Liquidity Sweep) Method: Entering a trade in the opposite direction of an initial breakout after price aggressively pierces a key level but immediately closes back inside the range, trapping early retail breakout traders.
Selecting which of these three core frameworks to deploy requires a dynamic assessment of the market’s current structural environment.
How to choose the right method for market conditions?
Choosing the optimal execution methodology requires a rapid structural audit of active market volatility and trend duration:
- Strong Trending Markets: Deploy the Breakout Continuation or Pullback method, as buying short-term dips ensures you ride the dominant wave of institutional volume with minimal heat.
- Sideways Consolidating Markets: Utilize the False Breakout method near the outer range boundaries, capitalizing on the mean-reversion characteristics that govern quiet, non-trending market environments.
- Low-Liquidity Session Openings: Remain completely flat in cash, as wide spreads and sporadic tick delivery make structural pattern validation highly unreliable.
Once you have selected your baseline method, the next step involves identifying the specific candlestick patterns that serve as your final entry triggers.
Price action patterns and how to read them effectively?
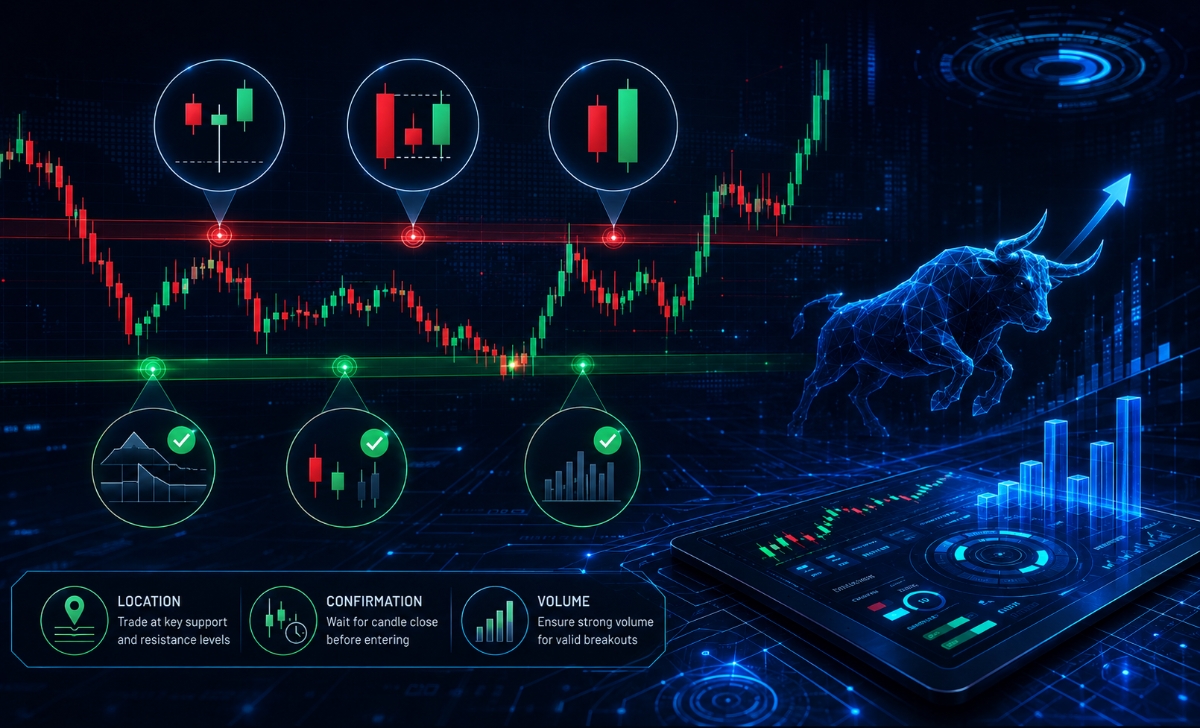
Price action patterns are localized combinations of candlesticks that signal an immediate continuation or exhaustion of trend momentum, with the most important structures being the Pin Bar, Inside Bar, and Engulfing Candle.
A valid price pattern that prints directly at a historical daily key level achieves an execution success rate that is 25% higher than a pattern appearing inside the middle of an unorganized trading range. Mastering the art of reading these formations effectively enables you to confirm your trade theories with absolute mathematical confidence right before clicking your execution terminal.
What are the most important price action patterns?
To construct a professional charting arsenal, you must isolate and master these three non-negotiable candlestick configurations:
- The Pin Bar (Rejection Candle): A candle featuring a tiny body paired with a massive nose or lower tail that makes up at least two-thirds of its total length, confirming an immediate structural price rejection.
- The Engulfing Candle (Momentum Trigger): A two-candle formation where the second candle body completely swallows the entire range of the preceding candle, signaling an aggressive influx of institutional volume.
- The Inside Bar (Volatility Compression): A small candle that sits completely within the high-and-low boundaries of the previous “mother bar,” highlighting a temporary pause right before a massive breakout explosion.
While these shapes are easily recognizable, retail traders frequently lose capital by executing them prematurely without checking for confirmation.
How to avoid false signals when trading patterns?
To successfully eliminate false signals and protect your account from predatory liquidity sweeps, implement these three strict analytical filters:
- Enforce Location Criteria: Completely ignore patterns that manifest inside the middle of a range; only execute setups that print directly against confirmed daily or weekly support/resistance lines.
- Wait for the Candle Close: Never place an entry order while a candlestick is still actively painting; an apparently perfect pin bar can easily transform into a losing breakout trading candle within the final seconds of a session.
- Verify Volume Synchronization: Cross-reference your pattern breakouts with real-time volume feeds or tick data; a true momentum pattern must be backed by expanding transaction size to ensure institutional follow-through.
By securing your pattern parameters with these defensive filters, you can confidently integrate your knowledge into a cohesive, live execution strategy.
Price action trading strategies for real execution
An effective price action trading strategy requires integrating market bias filters, structural entry triggers, protective stop-loss buffers, and non-emotional profit targets into a single, automated ruleset.

Running a strategy that lacks even one of these structural components turns your trading into pure gambling, causing rapid account erosion due to unmanaged risk-to-reward ratios. Executing a highly organized strategy within premium, ultra-low latency routing environments like the one featured on the MBroker ensures that your calculated entry coordinates match your actual live fill rates with absolute precision.
What elements form an effective price action strategy?
A robust, institutionally viable trading strategy must contain four mandatory operational parameters:
- The Trend Filter: Defining the macro direction using market structure to ensure you never trade against dominant institutional pools.
- The Trigger Condition: A non-negotiable candlestick pattern (such as an engulfing candle) that signals the exact second to open your position.
- The Invalidation Level (Stop-Loss): A fixed structural coordinate placed behind the pattern structure where your trade theory is proven completely wrong.
- The Profit Target (Take-Profit): An objective mathematical level calculated at the next logical support/resistance floor, targeting at least a minimum $$1:2 \text{ Risk-to-Reward$$ ratio.
Once this baseline strategy is fully operational, you can begin tweaking specific technical variables to maximize your long-term expectancy curve.
How to improve price action strategy performance?
To significantly elevate the mathematical performance of your execution strategy, enforce these three tactical upgrades:
- Implement Multi-Timeframe Alignment: Only execute short-term 15-minute price patterns if their breakout path perfectly matches the directional momentum of the higher 4-hour daily chart.
- Deploy a Risk-Free Breakeven Protocol: Automatically move your protective stop-loss to your exact entry price once the trade hits a $$1:$$ risk-to-reward profit buffer, completely removing financial risk from the equation.
- Leverage Premium Broker Infrastructure: Reviewing the raw price feeds and professional educational resources provided on the MBroker allows you to trade on clean, unmanipulated charts where execution delays and artificial spread widening never disrupt your strategy’s performance.
To unlock the true power of this strategy, you must blend your localized pattern signals with the overarching concept of global market structure.
Market structure in price action trading
Market structure is the foundational mapping framework that uses sequential swing highs and swing lows to define whether a financial asset is in a macro uptrend, a downtrend, or a horizontal consolidation phase.

Market structure represents the true blueprint of global financial cycles; an asset remains in a confirmed uptrend as long as it continually prints higher highs and higher lows on your charting panel. Mastering this structural logic allows you to look past localized candlestick noise and read the broader macroeconomic waves driving the international banking network.
What is market structure in trading?
In active trading, market structure is the formal classification of price movement based on its ongoing directional geometry.
An Uptrend is defined by a clean sequence of Higher Highs (HH) and Higher Lows (HL); a Downtrend consists of a continuous chain of Lower Highs (LH) and Lower Lows (LL); and a Ranging Market displays equal highs and equal lows, highlighting a perfect equilibrium between buyers and sellers. A structural trend shift occurs only when price breaks through a previous structural pivot point, a critical event known across trading desks as a Break of Structure (BOS).
Understanding this structural scaffolding allows you to discard arbitrary indicators and find high-probability entry points directly on your chart’s natural floors.
How to use market structure for better trade entries?
To secure institutional-grade trade entries, utilize market structure to identify the exact coordinates where fresh trend waves are mathematically highly probable to begin:
- In an Uptrend: Wait for price to complete a higher high breakout and then pull back into the previous swing high structural level, executing your long position precisely at the formation of a fresh higher low.
- In a Downtrend: Wait for a lower low break, track the corrective upward pull, and execute short orders at the exact point where a lower high forms against a daily horizontal ceiling.
- Enforce Stop Alignment: Place your protective stop-loss order a few pips behind the most recent structural pivot low or high, ensuring that your financial position can only be closed out if the broader macro trend completely fails.
In short, mastering Price Action is a non-negotiable step toward removing lagging indicators from your charts and trading in perfect synchronization with institutional order flow. By classifying market structure, waiting for confirmed candlestick patterns in historical key zones, and executing a rigid, rule-based strategy, you can easily eliminate costly trading guesswork. To track live price action geometry with pristine data feeds, access advanced charting resources, and protect your portfolio with premium tools, start your next trading session directly on the MBroker.

Thoren Vextal is a specialist in XM trading guides, offering practical insights and real-market experience to help traders improve their strategies and trading performance. Email: [email protected]