
 Tiếng Việt
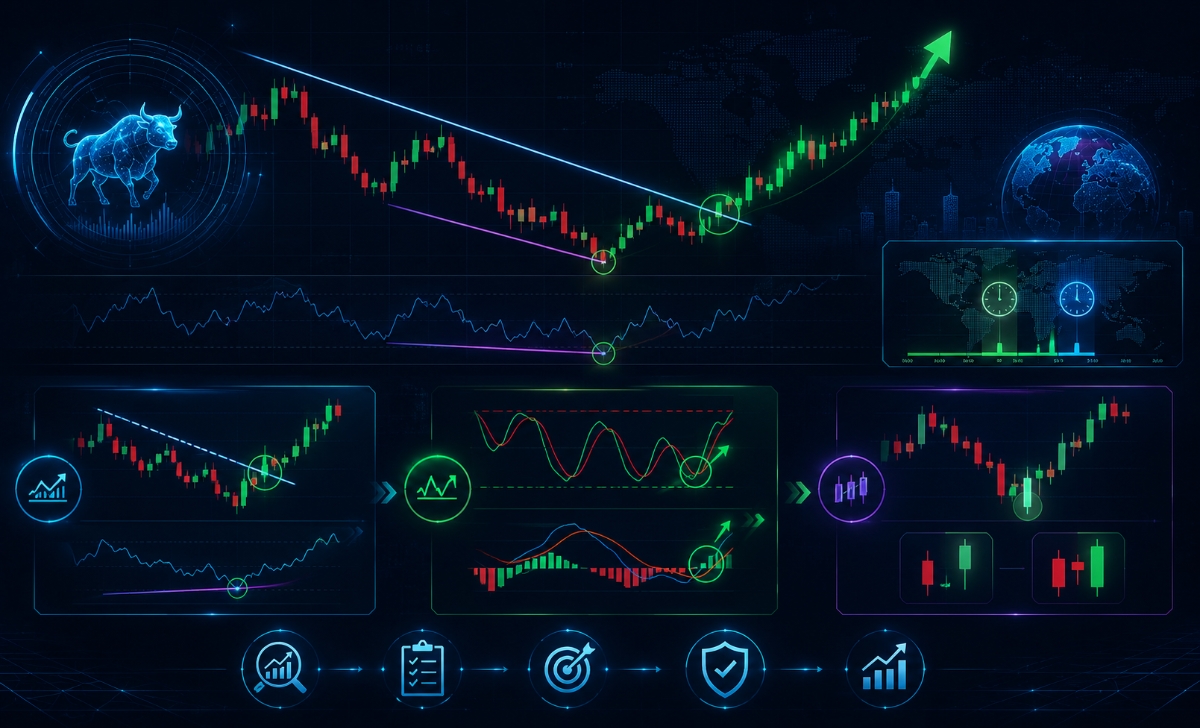
Divergence trade in forex identifies price reversals by comparing price action with indicator movement, helping traders detect early trend weakness before the market turns.
Moreover, divergence signals appear as regular and hidden divergence, indicating either potential reversals or trend continuation opportunities.
Additionally, the best divergence entries occur after confirmation at key support/resistance levels, improving risk-reward and reducing false signals.
Furthermore, confirmation tools like RSI, MACD, and price action patterns increase divergence accuracy, ensuring higher probability trades.
Mastering divergence trading is essential for spotting early reversals and improving trade timing. XM Guide traders gain practical guidance to apply divergence signals, entries, and confirmations effectively in real forex markets.
Divergence trade in forex and how it works?
A divergence trade in forex is a highly predictive counter-trend execution strategy that identifies a structural mismatch between real-time price candles and a technical momentum oscillator to forecast an imminent market reversal.

Divergence occurs when price prints a fresh extreme high or low that is not mathematically mirrored by the indicator, revealing a hidden exhaustion in institutional volume. This tactical setup serves as an early-warning mechanism, allowing retail day traders to anticipate trend collapses and secure high-probability entry points before the broader market reacts.
What is divergence in forex trading?
In forex trading, divergence represents a split in directional harmony between price action and momentum tracking lines. Under standard conditions, price and oscillators move together; when a currency pair prints a higher swing high, the indicator should also print a higher peak. Divergence manifests the exact moment this relationship breaks down—such as price hitting a lower low while the indicator establishes a higher low—proving that the prevailing trend has run out of genuine capital backing.
Recognizing this internal structural decay explains why professional day traders actively build complete portfolios around these specific setups.
Why do traders use divergence in trading strategies?
Traders integrate divergence into their trading strategies because it provides an objective, non-lagging look at shifting market velocity. While standard moving averages force you to react late to an already established trend, tracking oscillator discrepancies allows you to identify macro turning points ahead of the crowd. Furthermore, this structural method provides highly compressed risk parameters, enabling you to position tight protective stop-losses right above or below the newly formed swing boundaries for optimized risk-to-reward metrics.
Once you understand the basic operational logic of these discrepancies, you must learn to classify the specific signals they generate.
Signals of divergence in forex trading
Signals of divergence in forex trading are divided into regular signals—which warn of an immediate trend reversal—and hidden signals, which confirm that a dominant macro trend is ready to continue.

Statistically, regular discrepancies carry an exceptionally high win rate when tracking major currency pairs, as they isolate the exact price coordinates where institutional liquidity providers pull their resting orders from the book. Correctly separating these mechanical variations prevents you from misinterpreting a brief pullback as a structural market collapse.
What are the main types of divergence signals?
The technical market structure produces four independent divergence configurations that dictate your strategic direction:
- Regular Bullish Divergence: Price prints a lower low, but the indicator prints a higher low, signaling an immediate upward trend reversal.
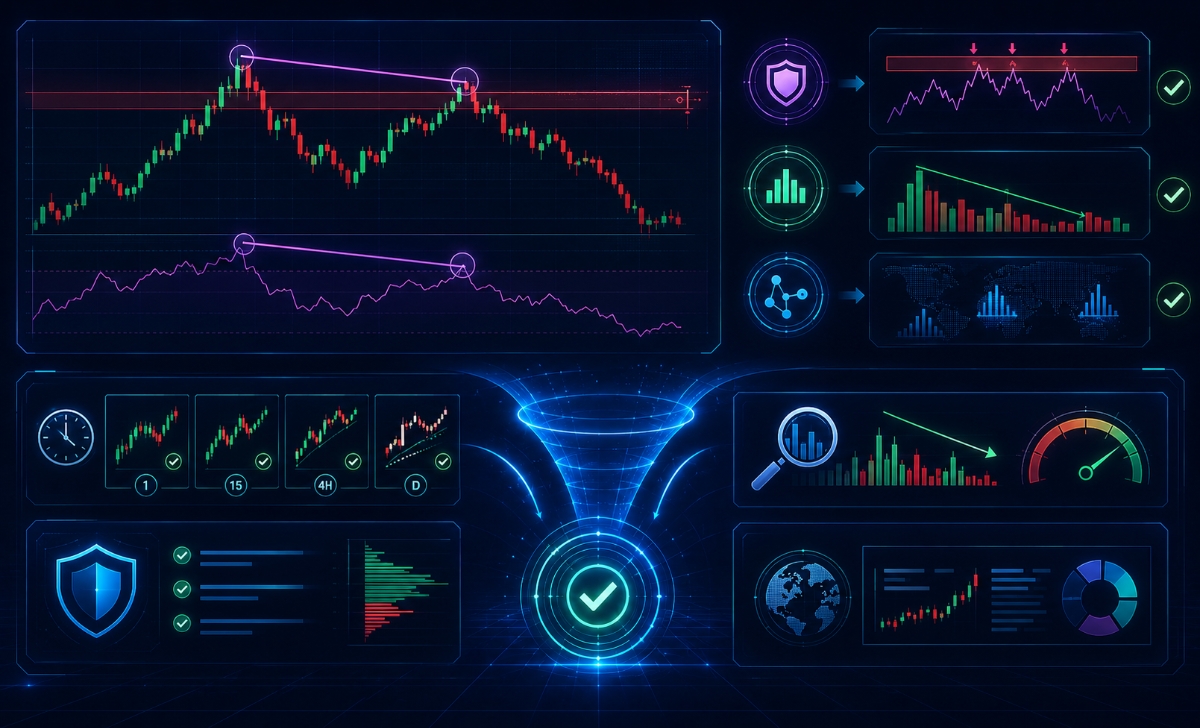
- Regular Bearish Divergence: Price prints a higher high, but the indicator forms a lower high, indicating an imminent downward market crash.
- Hidden Bullish Divergence: Price forms a higher low, but the indicator shows a lower low, confirming that the broader upward trend is ready to resume.
- Hidden Bearish Divergence: Price establishes a lower high, but the indicator shows a higher high, verifying that the macro downward trend remains fully intact.
To track these distinct variations accurately, you must deploy the correct algorithmic tools in your charting workspace.
Which indicators are commonly used for divergence signals?
The most reliable and historically verified technical oscillators utilized across institutional macro desks include:
- The Relative Strength Index (RSI): A 14-period momentum oscillator ideal for tracking swift structural regular divergence signals at extreme overbought (<70) or oversold (<30) thresholds.
- The MACD (Moving Average Convergence Divergence): An indicator that leverages exponential averages to expose deep, volume-backed directional shifts and long-term hidden trends.
- The Stochastic Oscillator: A highly sensitive momentum tool that uses twin speed lines ( %K and % D ) to pinpoint short-term intraday trend turning points.
Isolating these visual tracking lines is only half the battle; the final profitable milestone requires converting these signals into strict entry rules.
Entry strategies for divergence trade
Entry strategies for a divergence trade require a rule-based execution protocol that dictates your exact order placement, risk protection, and technical validation parameters.
Jumping into a trade the exact millisecond a line discrepancy appears on a lower timeframe results in a failure rate of over 55% due to extended trend expansion. Professional market operators never guess their entry levels; they wait for price action to confirm that momentum has officially shifted before deploying any portfolio capital.
When is the best time to enter a divergence trade?
The optimal time to execute a position is during the London and New York session overlaps (13:00 to 16:00 GMT), when global interbank volume reaches its daily peak. During this liquid timeframe, institutional market makers are actively hunting stop-loss pools, creating sharp price sweeps that form highly reliable regular divergence patterns across major pairs. Executing your positions during these peak hours ensures that your trade has immediate momentum follow-through, preventing your account from getting stuck in choppy, sideways price action.
To protect your capital curve from sudden market shifts during these hours, you must use a structured entry method.
What are the most effective entry methods?
To enter a position with maximum safety and precision, implement one of these three professional execution techniques:
- The Trendline Breakout Method: Draw a localized trendline over the closing prices of the divergence structure; execute your market order only when a candle closes completely outside that boundary.
- The Oscillator Crossover Trigger: Wait for the Stochastic or MACD lines to form a clean, defensive crossover outside their overbought or oversold zones before placing your trade.
- The Price Action Candlestick Confirmation: Postpone entry until a definitive reversal of candlestick pattern—such as a Bullish Engulfing or Pin Bar—prints directly at the structural swing high or low.
While these entry methods provide excellent structure, adding a secondary layer of confirmation helps eliminate false breakouts.
Confirmation techniques for divergence trading
Confirmation techniques for divergence trading are advanced filtering protocols that combine volume tracking, multi-timeframe analysis, and structural price levels to filter out false signals.
Data proves that verifying your momentum discrepancies with an independent technical filter can elevate a strategy’s win rate by up to 22% over a standard 100-trade sample size. Enforcing these confirmation filters ensures that you only risk your capital when multiple independent market variables point to the exact same directional outcome.
How to confirm divergence signals before trading?
To confirm a signal before risking any capital, you must use a strict top-down multi-timeframe confirmation checklist. If you locate an attractive regular bearish setup on the 15-minute chart, you must instantly look up at the 4-hour or Daily macro chart to evaluate the broader structural context. If the higher timeframe chart shows that the asset is currently trading directly into a major historical horizontal resistance zone, your short-term reversal signal gains massive structural validation, making it highly safe to execute.
To automate this multi-layered checking routine, top-tier day traders pair price geometry with specific algorithmic tools.
What confirmation tools improve divergence accuracy?
To maximize your directional accuracy, combine your core chart patterns with these three independent tools:
- Horizontal Support & Resistance Zones: Only execute regular setups that manifest directly at major weekly or monthly supply/demand ceilings.
- Volume Indicators (e.g., OBV or Chaikin Money Flow): Verify that a bearish signal is accompanied by a sharp contraction in buying volume, confirming that institutional participation has officially dried up.
- The MBroker Verification Framework: Reviewing the technical sentiment reports and raw institutional data feeds available on the MBroker helps ensure your charting software remains perfectly synchronized with the true interbank order flow, eliminating artificial price spikes.
Once you have mastered these validation steps, you are fully prepared to apply these concepts within live market conditions.
Applying divergence trade in real forex market conditions
Applying a divergence trade in real forex market conditions requires integrating your technical setups into a comprehensive risk management plan and avoiding common psychological execution traps.

Professional risk managers understand that no single technical indicator is infallible; even a perfect regular divergence pattern can fail if a major geopolitical event suddenly shifts market sentiment. By combining your pattern entries with strict position-sizing models, you ensure that a random string of losses will never cause major drawdowns on your account.
How to combine divergence with overall trading strategy?
To successfully integrate these signals into your broader trading system, use them primarily as a primary filter to manage your overall market bias. For example, if your strategy focuses on trend-following breakout systems, encountering a clear regular bearish pattern on the daily chart should serve as an immediate trigger to stop opening new long positions. By using these momentum discrepancies to dynamically adjust your direction, you keep your portfolio perfectly aligned with macro capital flows while using short-term pullbacks to safely accumulate positions.
Even with a comprehensive plan in place, you must actively protect your account from the most destructive retail trading blunders.
What are common mistakes when trading divergence?
The most damaging mistake a trader can make is attempting to trade momentum discrepancies during a highly aggressive, news-driven vertical trend. During a macro breakout event, oscillators can remain embedded in overbought or oversold territories for days, generating a sequence of false reversal signals that can quickly wipe out an account if you try to fight the trend. Furthermore, many retail traders fail to cross-reference their execution parameters with institutional platform calendars; to prevent these unforced errors and access advanced technical updates, ensure you utilize the real-time tools and education resources available on the MBroker.
In short, executing a Divergence Trade is an exceptional strategy for identifying momentum shifts and capturing high-probability trend reversals before they become obvious to the public. By separating regular and hidden signals, waiting for confirmed candle breaks, and filtering setups through major support or resistance zones, you can easily eliminate execution guesswork.

Thoren Vextal is a specialist in XM trading guides, offering practical insights and real-market experience to help traders improve their strategies and trading performance. Email: [email protected]