
 Tiếng Việt
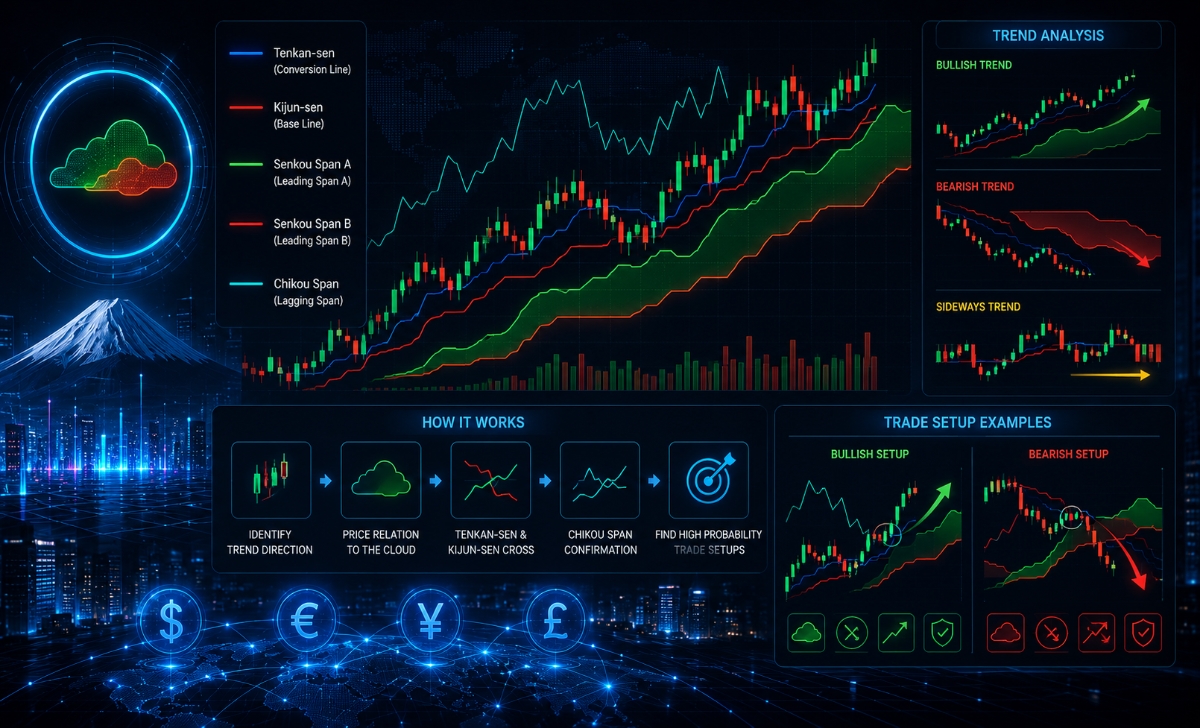
Ichimoku Indicator is an all-in-one system that identifies trend, momentum, and support/resistance in a single chart, widely used by professional traders for its clarity and structure.
Moreover, Ichimoku works by combining the Kumo cloud, Tenkan-sen, and Kijun-sen to define market direction and generate signals, providing a real-time view of price equilibrium.
Additionally, Ichimoku enables precise trend analysis by showing direction and strength through price position relative to the cloud, helping traders filter high-probability trends.
Furthermore, Ichimoku trade setups are built using cloud breakouts, line crossovers, and confirmation signals, allowing traders to define clear entry, stop loss, and take profit levels.
Mastering the Ichimoku Indicator is essential for accurate trend analysis and structured trade setups. At Forex Technical Analysis, traders gain practical strategies to apply Ichimoku effectively in real market conditions.
What is the Ichimoku Indicator and why do professional traders use it?
The Ichimoku Indicator, officially known as Ichimoku Kinko Hyo, is a comprehensive technical analysis system that calculates momentum, support, resistance, and trend direction simultaneously using five specialized equilibrium lines.
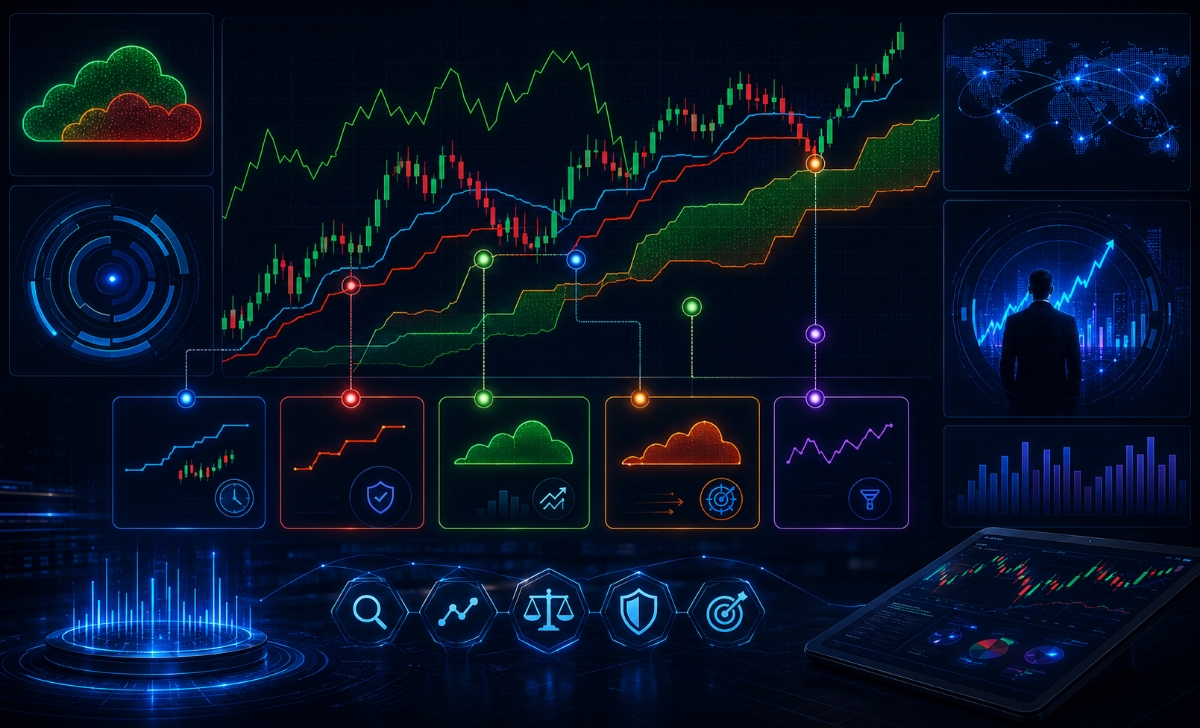
While traditional indicators lag behind current price action, Ichimoku projects key support and resistance zones 26 periods into the future, allowing institutional operators to anticipate major market shifts with massive visual clarity. Financial professionals deploy this tool because it filters out random market noise, providing an immediate, data-driven answer to whether a market is trending bullishly, breaking down into a bearish cycle, or consolidating in a dangerous sideways range.
What components make up the Ichimoku Indicator?
The standard layout of the system features five distinct components, each calculated using specific historical price ranges rather than standard closing prices:
- Tenkan-sen (Conversion Line): A fast-moving component calculated as the midpoint of the highest high and lowest low over the past 9 periods, tracking immediate momentum.
- Kijun-sen (Base Line): A slower baseline calculated as the midpoint of the highest high and lowest low over the past 26 periods, serving as a core structural support/resistance boundary.
- Senkou Span A (Leading Span A): The midpoint between Tenkan-sen and Kijun-sen, shifted and plotted 26 periods forward into the future.
- Senkou Span B (Leading Span B): The midpoint of the highest high and lowest low over the past 52 periods, also plotted 26 periods forward.
- Chikou Span (Lagging Span): The current session’s closing price plotted exactly 26 periods backward into the past, used to filter out false breakouts.
The interaction between Leading Span A and B forms the shaded area known as the Kumo (Cloud), which elevates this tool beyond simple moving average bundles.
Why is Ichimoku considered an all-in-one trading system?
Ichimoku is considered an all-in-one trading system because it simultaneously delivers trend direction, momentum metrics, and future support/resistance zones within a single charting matrix, eliminating the need to stack multiple conflicting indicators. A single glance at the screen allows a trader to determine if an asset is entering an aggressive breakout phase or a decaying trend. Because the indicator provides its own built-in trade filters, it functions as a standalone trading methodology that handles everything from asset screening to risk management.
Once you understand the basic anatomy of these five components, you can begin tracking how they behave dynamically under live trading conditions.
How does the Ichimoku Indicator work in real market conditions?
In real market conditions, the Ichimoku Indicator works by continuously evaluating the equilibrium of price action, using the dynamic thickness of its cloud structure and the crossing velocity of its momentum lines to forecast trend continuations or market reversals.
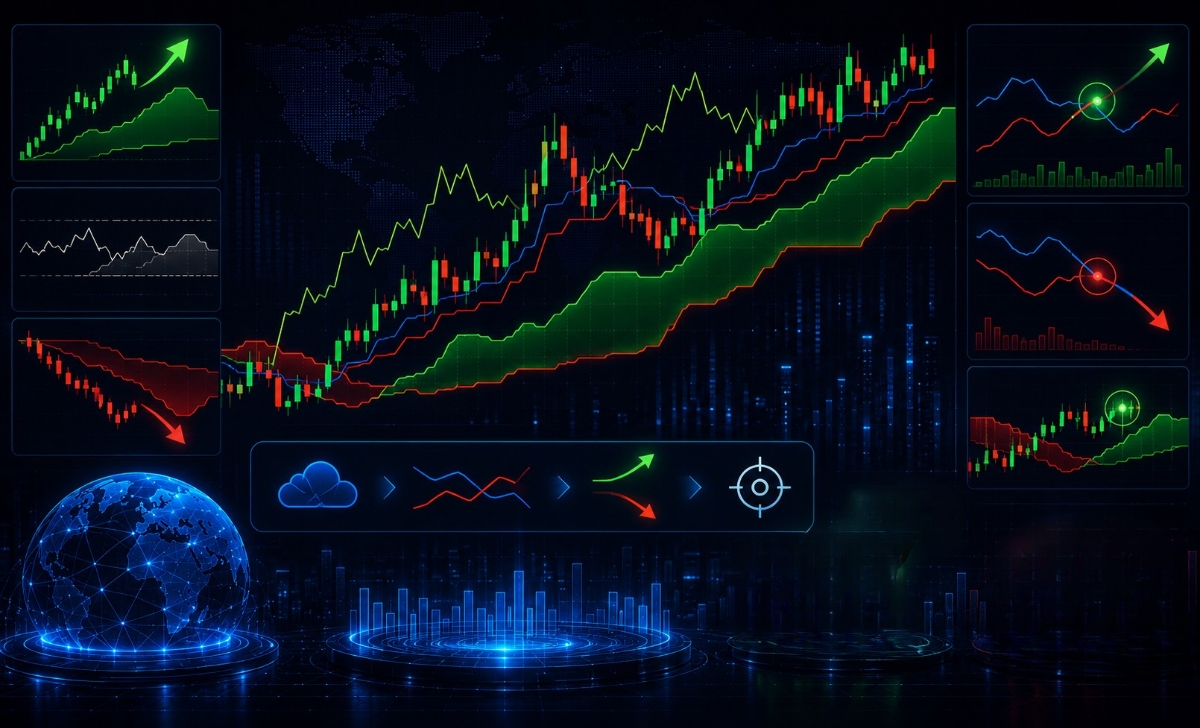
Data shows that the system performs with the highest accuracy in clear trending markets, where its lines expand to act as major dynamic floors or ceilings that repel counter-trend pullbacks. When price action interacts with these specific zones, the system generates real-time institutional buy or sell alerts based on the shifting balance of global supply and demand.
How does Ichimoku cloud (Kumo) define market direction?
The Kumo (Cloud) defines macro market direction based on the position of the live price candles relative to its shaded boundaries:
- Bullish Market Direction: Price trades cleanly above the Kumo, indicating that buyers are completely in control, while the cloud below shifts to a green color as Senkou Span A stays above Senkou Span B.
- Bearish Market Direction: Price trades completely below the Kumo, confirming a dominant downtrend, while the cloud shifts to a red color as Senkou Span B resides above Senkou Span A.
- Consolidation / Sideways Range: Price gets trapped directly inside the Kumo boundaries, signaling a low-liquidity environment where traders should stay flat.
While the cloud acts as your macro directional filter, the fast-moving inner lines calculate the precise timing of your entries.
How do Tenkan-sen and Kijun-sen generate trading signals?
Tenkan-sen and Kijun-sen generate highly reliable trading signals through mechanical crossovers that function similarly to moving averages but react much faster to volatile price ranges. A Bullish TK Cross occurs when the fast Tenkan-sen crosses above the slower Kijun-sen, signaling an immediate acceleration in buying momentum. Conversely, a Bearish TK Cross triggers when Tenkan-sen drops below Kijun-sen, indicating a massive spike in institutional selling pressure.
To maximize your success with these crossovers, you must integrate them into a standardized, rule-based trend analysis routine.
How to use Ichimoku for clear and reliable trend analysis?
To use Ichimoku for clear and reliable trend analysis, an investor must systematically cross-reference the current position of price relative to the cloud with the directional slope of both the Kijun-sen and the lagging Chikou Span.
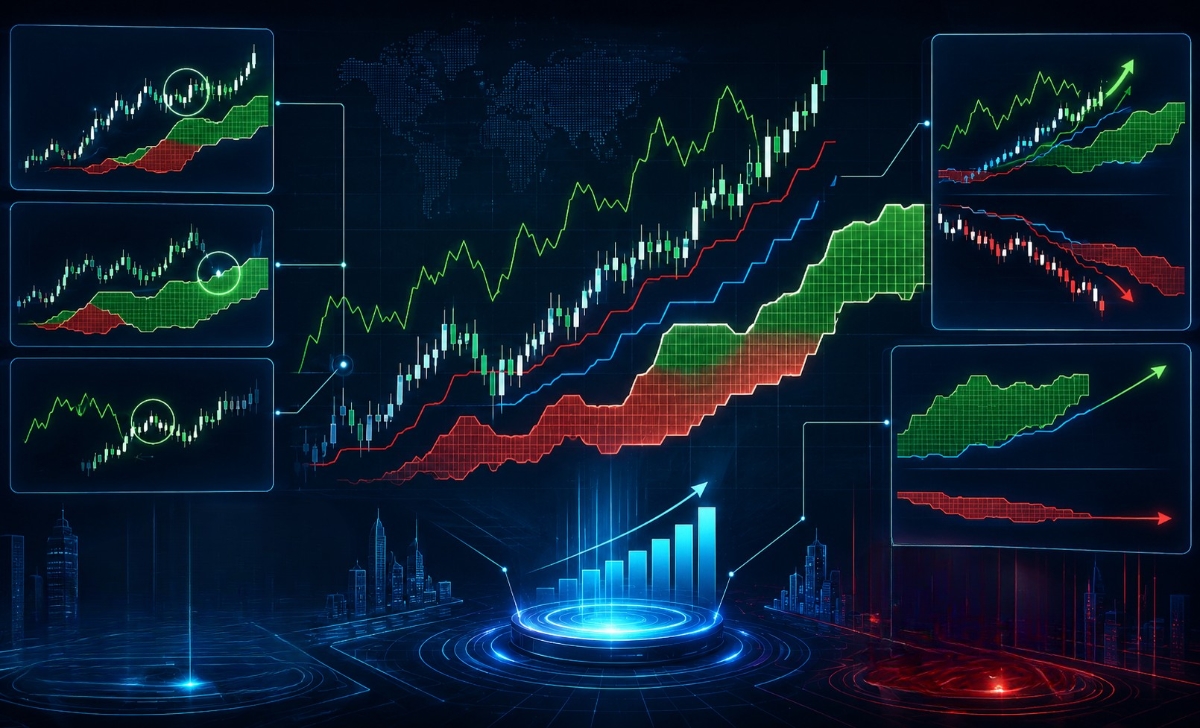
Statistically, a trend analysis setup is only verified as a high-probability environment when all five components point in the exact same directional path. Enforcing this strict technical checklist prevents you from taking low-probability trades during mature trends that are heavily exhausted and ready to drop into a correction.
How to identify trend direction using Ichimoku?
To identify a definitive market trend direction with maximum accuracy, execute this three-tiered structural audit:
- Check the Cloud Location: Confirm whether the current live price candles are positioned completely above the cloud (Bullish) or completely below the cloud (Bearish).
- Verify the Cloud Color: Ensure the future cloud matches your bias (a green future cloud for long positions, a red future cloud for short entries).
- Inspect the Chikou Span: Verify that the lagging Chikou line is completely free of any historical price candle obstacles (trading above past candles for longs, or below past candles for shorts).
Once you establish a clean trend direction, your next task is calculating whether that trend possesses enough velocity to sustain a breakout.
How to evaluate trend strength with Ichimoku?
Trend strength is evaluated by measuring the vertical thickness of the Kumo and the angle of the Kijun-sen baseline. A thick, expanding cloud indicates a highly stable macro trend backed by deep institutional order blocks, making it incredibly difficult for counter-trend traders to break through. Furthermore, if the Kijun-sen is sloping steeply at a sharp 45-degree angle, it confirms that the market is accelerating rapidly, whereas a flat Kijun-sen reveals a stagnant market that is prone to ranging conditions.
After mastering this structural trend analysis, you can begin assembling these components into a high-probability execution setup.
How to build a high-probability trade setup with Ichimoku?
Building a high-probability trade setup with Ichimoku requires waiting for a confluence of multiple signals—specifically a confirmed Kumo Breakout combined with a supportive TK Crossover—before executing any live positions on your terminal.
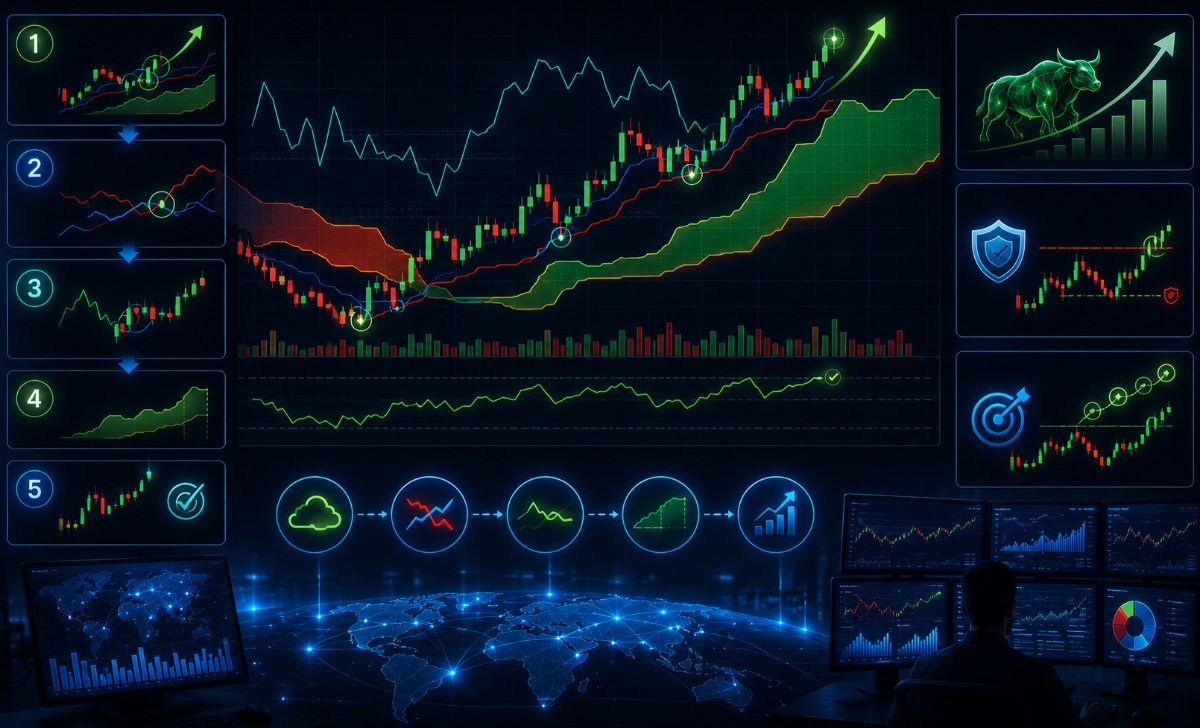
Institutional day traders never enter a market simply because a single line crosses; they require a comprehensive checklist to align perfectly before risking portfolio equity. When these structured multi-line confirmations are executed within optimized routing conditions like those found on the MBroker, traders can easily maximize their execution accuracy while keeping transaction fees exceptionally low.
What is a step-by-step Ichimoku trade setup?
To execute a complete, institutional-grade long trade setup, implement this 5-step mechanical checklist:
- Step 1: The Kumo Breakout: Wait for a complete candle to close cleanly above the upper boundary of the Ichimoku cloud structure.
- Step 2: The TK Confirmation: Verify that a Bullish TK Cross has occurred, with the Tenkan-sen trading above the Kijun-sen.
- Step 3: The Chikou Filter: Confirm that the lagging Chikou Span line is trading completely above the price candles from 26 periods ago.
- Step 4: The Future Projection: Look at the forward cloud 26 periods ahead and ensure it is displaying a healthy, expanding green structure.
- Step 5: The Execution: Open your long market position on the opening tick of the next candle, ensuring your charting platform displays synchronized real-time pricing data.
Once your entry order is active, you must immediately enforce your structural exit parameters to protect your trading account from sudden volatility.
Where to place stop loss and take profit?
Your protective stop-loss must be placed structurally just below the Kijun-sen baseline or directly underneath the lower boundary of the active Kumo cloud, ensuring you are automatically taken out if the trend breaks down. For long positions, if the market remains healthy, the Kijun-sen will act as a trailing support floor, allowing you to manually trail your stop-loss upward as the trend progresses. Your take-profit target should be calculated using a minimum 1:2 risk-to-reward ratio, or set at the next major historical horizontal resistance level identified on your chart.
To ensure your execution boundaries remain highly reliable over a long sample size of trades, you must optimize your charting environment for real-world trading.
How to improve Ichimoku performance in real trading environments?
Improving your Ichimoku performance requires applying strict multi-timeframe analysis filters and knowing when to combine your cloud metrics with standalone price action confirmation tools.

Professional fund managers never isolate their analysis to a single chart interval; they utilize higher timeframes to determine macro trend biases before hunting for entries on lower intervals. By utilizing a multi-layered verification strategy, you can easily filter out the inevitable false breakouts that occur during lower-liquidity sessions.
How to use Ichimoku in multi-timeframe analysis?
Multi-timeframe analysis is executed by using a higher-interval chart to establish your structural market filter, while utilizing a lower-interval chart to execute your actual trade entries:
- The Macro Filter (H4 or Daily Chart): Verify that the asset is trading in a clean macro trend (e.g., price is completely above a thick Daily Kumo cloud).
- The Execution Trigger (M15 or H1 Chart): Once your bullish macro bias is locked in, drop down to the lower chart and wait for a fresh bullish TK cross or a minor Kumo breakout to time your entry.
This classic top-down approach ensures that you never place a short-term trade that directly fights against a major institutional trend.
Should Ichimoku be combined with other indicators?
Yes, you should combine Ichimoku with a volume indicator or a traditional oscillator to create a highly robust, multi-dimensional filtering system:
- The Relative Strength Index (RSI): Combining the cloud with the RSI allows you to avoid entering long breakouts if the oscillator confirms the asset is extremely overbought.
- Volume Analysis: A verified cloud breakout should always be accompanied by an immediate expansion in trading volume to confirm genuine institutional participation.
- Premium Infrastructure Sourcing: Cross-referencing your technical signals with the institutional broker tutorials and educational updates published on the MBroker allows you to trade on pristine, unmanipulated feeds where cloud boundaries print with absolute geometric accuracy.
In short, the Ichimoku Indicator is a powerful, standalone system designed to streamline your trend analysis, clarify support levels, and deliver high-probability trade setups. By filtering your entries through the Kumo cloud, verifying momentum with the Chikou Span, and applying a multi-timeframe approach, you can easily remove emotional guesswork from your execution.

Thoren Vextal is a specialist in XM trading guides, offering practical insights and real-market experience to help traders improve their strategies and trading performance. Email: [email protected]