
 Tiếng Việt
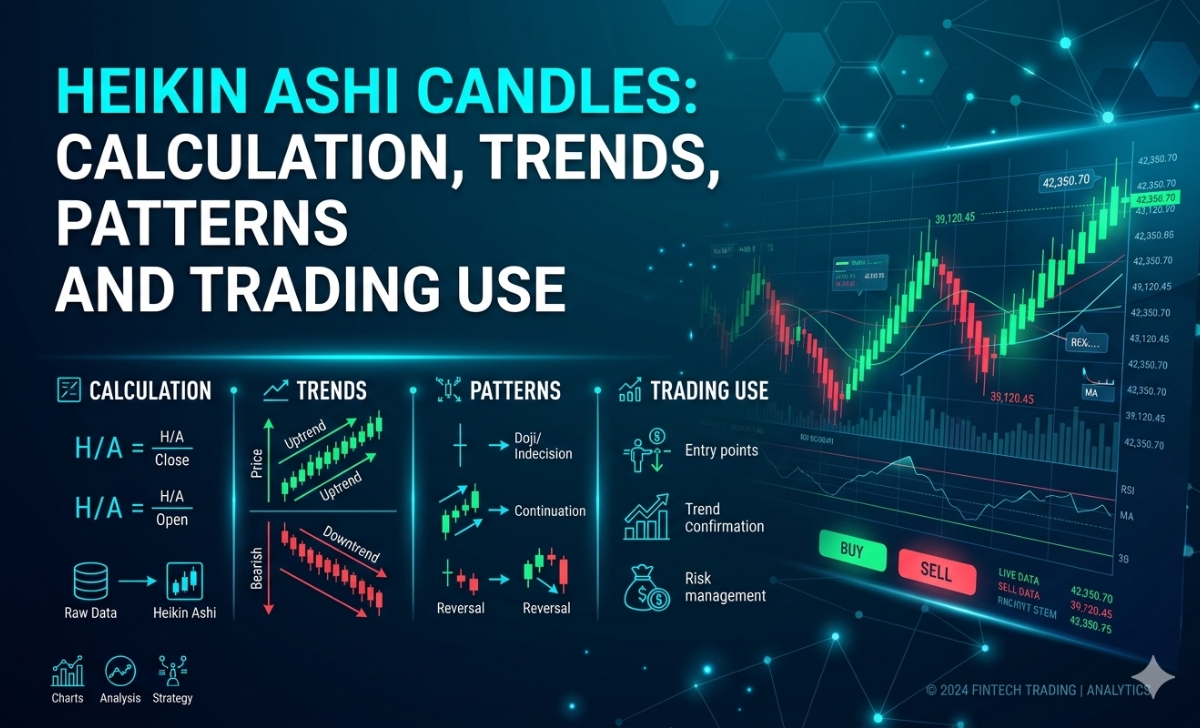
Heikin Ashi candles are modified candlesticks that smooth price data to highlight trends more clearly, reducing market noise compared to traditional Japanese candles.
Moreover, Heikin Ashi uses an averaged calculation formula instead of real price values, which creates smoother charts but delays exact price representation.
Additionally, Heikin Ashi helps identify strong bullish and bearish trends through consistent candle color and structure, making trend directions easier to follow.
Furthermore, Heikin Ashi patterns such as no-shadow candles or small bodies signal trend strength or reversal, offering clear visual cues for traders.
Therefore, Heikin Ashi is widely used in trading strategies to filter noise and improve trend-following entries, though it is less effective for precise entry timing.
Understanding Heikin Ashi candles helps traders improve trend analysis and reduce false signals. At Forex Technical Analysis, you can learn how to apply these tools effectively in real trading strategies.
Heikin Ashi Candles in technical analysis
Heikin Ashi candles are a specialized technical analysis charting technique that uses a modified price-averaging model to filter out market noise, isolate dominant financial trends, and visualize market momentum with high precision.

While standard charts display raw, volatile price fluctuations, this modified technique smooths out erratic price movements by filtering away up to 70% of short-term intraday market noise. By rebalancing the open, high, low, and close values into a unified average, these modified candlesticks allow retail day traders to easily identify sustained institutional trend directions without getting prematurely shaken out of highly profitable positions.
What are Heikin Ashi Candles and how are they different from Japanese candles?
Heikin Ashi candles (which translates from Japanese as “average bar”) differ fundamentally from traditional Japanese candlesticks in how they construct their individual open, high, low, and close components. A standard Japanese candlestick operates entirely on raw, independent transaction data, displaying the exact market print at the start and end of that specific time interval. Conversely, a Heikin Ashi candlestick relies on an interconnected averaging matrix, where each new candle’s open is structurally anchored to the dead center of the preceding bar’s body, creating a visually smoother and more sequential charting layout.
This foundational structural variation is exactly why modern market operators integrate this modified tool into their daily routines.
Why do traders use Heikin Ashi instead of traditional candlesticks?
Professional traders use Heikin Ashi charts instead of traditional candlesticks because they eliminate the psychological anxiety caused by deceptive, minor counter-trend retracements. On a standard chart, a strong uptrend is frequently interrupted by random, isolated red candles that tempt day traders into exiting their winning positions too early out of fear. A Heikin Ashi display filters these minor anomalies out completely, maintaining a solid, unbroken sequence of green candles during an expansion, which dramatically simplifies trend-following and trailing stop-loss management.
To fully trust this visual smoothing effect, you must analyze the exact mathematical calculations running behind the scenes.
Heikin Ashi calculation method
The Heikin Ashi calculation method relies on four highly specific, interdependent mathematical formulas that recalculate every single candle using a combination of current raw market data and the historical averages of the previous bar.

Because each new bar is mathematically linked to its predecessor, gaps are completely eliminated from the screen, forcing the charts to move in a highly fluid, orderly sequence. This systematic calculation ensures that every structural change in the color or shape of a candle represents a genuine shift in underlying mathematical momentum rather than a temporary, low-volume price spike.
How are Heikin Ashi candles calculated?
The structural anatomy of a Heikin Ashi candle is generated using these four specific mathematical formulas for each timeframe interval:
- Close ($$C_{HA$$): This is the simple average of the current period’s raw Open ($$$$), High ($$$$), Low ($$$$), and Close ($$$$).
Formula: Close_HA = (Open + High + Low + Close) / 4
- Open ($$O_{HA$$): This is the exact midpoint of the immediate preceding Heikin Ashi candle’s body.
Formula: Open_HA = (Open_HA_previous + Close_HA_previous) / 2
- High ($$H_{HA$$): The system scans and selects the absolute maximum value among three metrics: the current raw High, the current Heikin Ashi Open, or the current Heikin Ashi Close.
Formula: High_HA = Maximum of [Raw High, Open_HA, Close_HA]
- Low ($$L_{HA$$): The system selects the absolute minimum value among three metrics: the current raw Low, the current Heikin Ashi Open, or the current Heikin Ashi Close.
Formula: Low_HA = Minimum of [Raw Low, Open_HA, Close_HA]
Understanding these core calculations exposes how drastically this indicator alters your physical chart screen.
What impact does calculation have on price representation?
Because this calculation method integrates historical trailing data, the closing price displayed on a Heikin Ashi candle will not match the live, actual interbank market transaction price at that exact millisecond. This internal mathematical lag creates a highly predictable smoothing effect across your charting interface, trading volume indicators, and trend models. For day traders, this means your chart serves primarily as a pure momentum-tracking radar, requiring you to monitor raw prices separately when calculating your exact fill costs and order entry execution levels.
Once you adapt to this unique pricing representation, you can leverage its smoothed data to rapidly diagnose structural market trends.
Trend identification using Heikin Ashi candles
Trend identification using Heikin Ashi candles is achieved by scanning the structural color of the candle bodies and checking for the complete absence of opposing shadows or wicks on the bars.
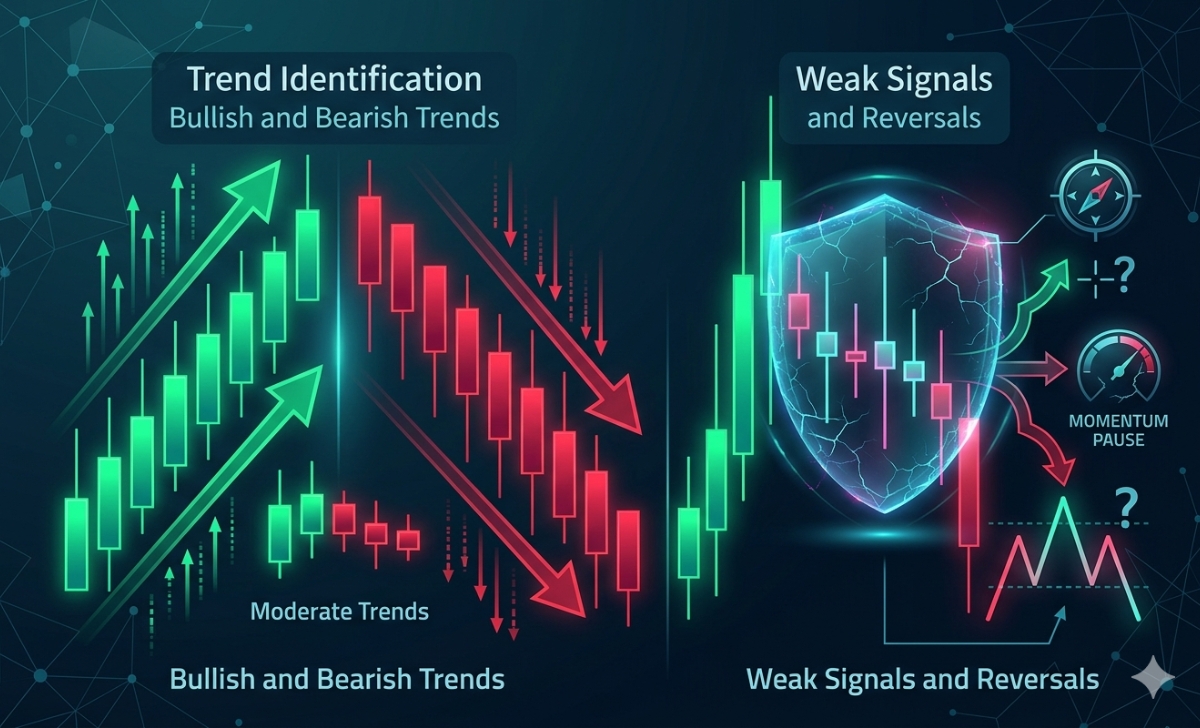
A strong, healthy bullish trend is characterized by a sequential chain of thick green candles that feature 0% lower wicks, whereas a verified bearish trend displays a clean chain of red candles with 0% upper wicks. This clear, binary visual rule allows trend-following algorithms and manual investors to accurately evaluate global market direction within fractions of a second without encountering visual ambiguity.
How to identify bullish and bearish trends with Heikin Ashi?
To identify structural trend direction with absolute accuracy, apply this simple diagnostic visual checklist to your screen:
- Strong Bullish Trend: Look for consecutive green (or white) candle bodies that possess substantial vertical length and feature completely flat bottoms with no lower shadows.
- Moderate Bullish Trend: Green candles continue to print, but minor lower wicks begin to appear, indicating a decrease in immediate buyer aggression.
- Strong Bearish Trend: Look for consecutive red (or black) candle bodies that possess substantial vertical length and feature completely flat tops with no upper shadows.
- Moderate Bearish Trend: Red candles continue to manifest, but minor upper wicks emerge, indicating that short sellers are meeting local buying support.
By masterfully categorizing these individual trend phases, you can easily protect your portfolio from late entries just as a trend begins to tire.
When does a trend signal become weak or reverse?
A trend signal becomes structurally weak the exact moment the candle bodies begin to shrink significantly in size and long wicks begin to emerge from both the top and the bottom of the bar simultaneously. This specific geometric shift prints a classic Doji-like cross pattern on your screen, proving that the buying and selling forces have reached complete equilibrium. When you spot these small, dual-wick candles clustering together after an aggressive price extension, it serves as an early-warning signal that institutional momentum has completely paused and an immediate market reversal is underway.
Recognizing these specific momentum changes allows us to transition from general trend observation to isolating high-probability chart pattern structures.
Heikin Ashi patterns and price behavior
Heikin Ashi patterns and price behavior focus entirely on structural consolidation boundaries, consecutive candle sequences, and directional momentum breakout triggers that signal institutional capital reallocation.
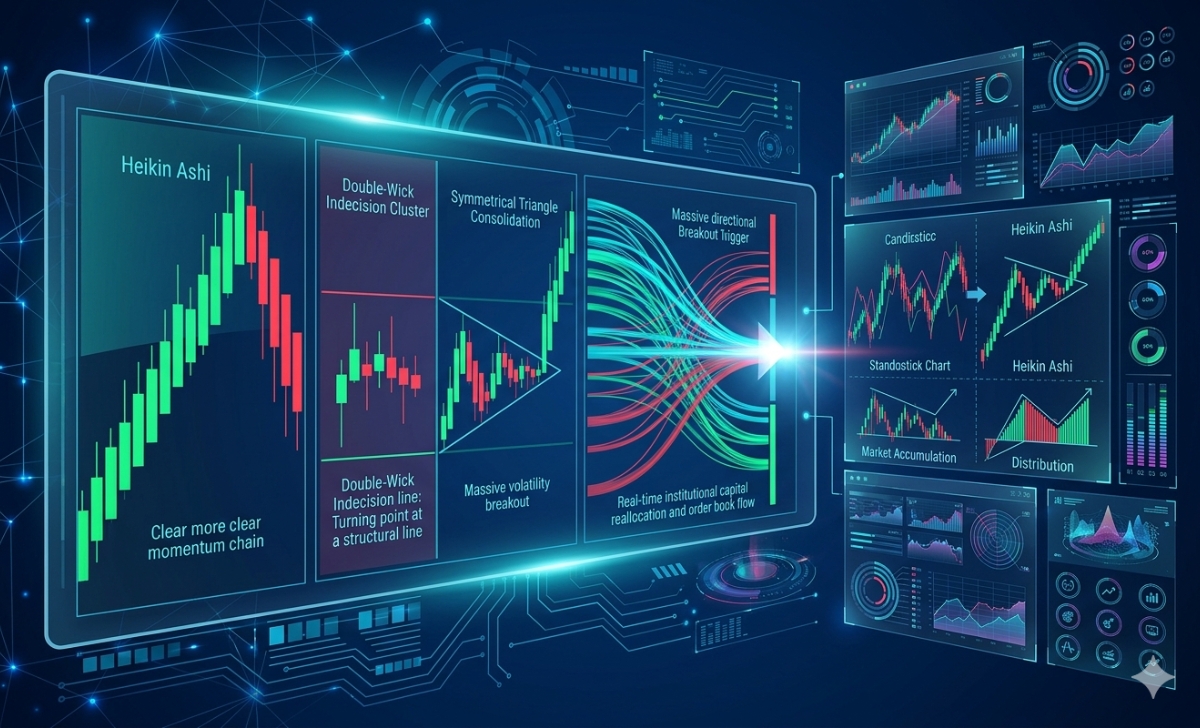
Statistically, because these charts minimize erratic price noise, classic geometric patterns like wedges or triangles present far cleaner, more symmetrical lines than those found on traditional candlestick displays. Analyzing these refined behavioral patterns provides day traders with an ultra-clear view of market accumulation and distribution phases before a major market breakout occurs.
What common Heikin Ashi patterns should traders watch?
To maximize your market forecasting accuracy, monitor your charts for these three high-probability behavioral patterns:
- The Continuous Momentum Chain: A sequence of three or more large, identical-colored candles with zero opposing wicks, signaling an optimal environment to scale into a trend.
- The Double-Wick Indecision Cluster: A group of two or more small, centered candle bodies with long upper and lower wicks, mapping out a major structural support or resistance turning point.
- The Symmetrical Triangle Consolidation: A pattern where the high and low wicks converge tightly into a horizontal apex, signaling that a massive volatility breakout is building in the order book.
Understanding how to spot these shapes is an excellent start, but you must also know how reliably they perform under real market conditions.
How reliable are Heikin Ashi patterns in trading?
Heikin Ashi patterns exhibit exceptionally high historical reliability when used strictly as directional trend-confirmation filters and breakout validation tools. Because the averaging formula automatically requires multiple periods of sustained price movement to alter the color of a candle, false breakouts or “bull traps” are naturally suppressed on your user terminal. However, their structural reliability drops significantly when you attempt to trade them in low-volume, range-bound consolidating markets, as the lagging nature of the averaging formula can generate late signals inside tight horizontal boxes.
To unlock the full economic potential of these reliable setups, you must integrate them into a complete, rule-based execution strategy.
Trading use of Heikin Ashi candles in real markets
The trading use of Heikin Ashi candles in real markets involves deploying a disciplined multi-timeframe strategy that filters entries through momentum indicators while carefully accounting for execution price differences.
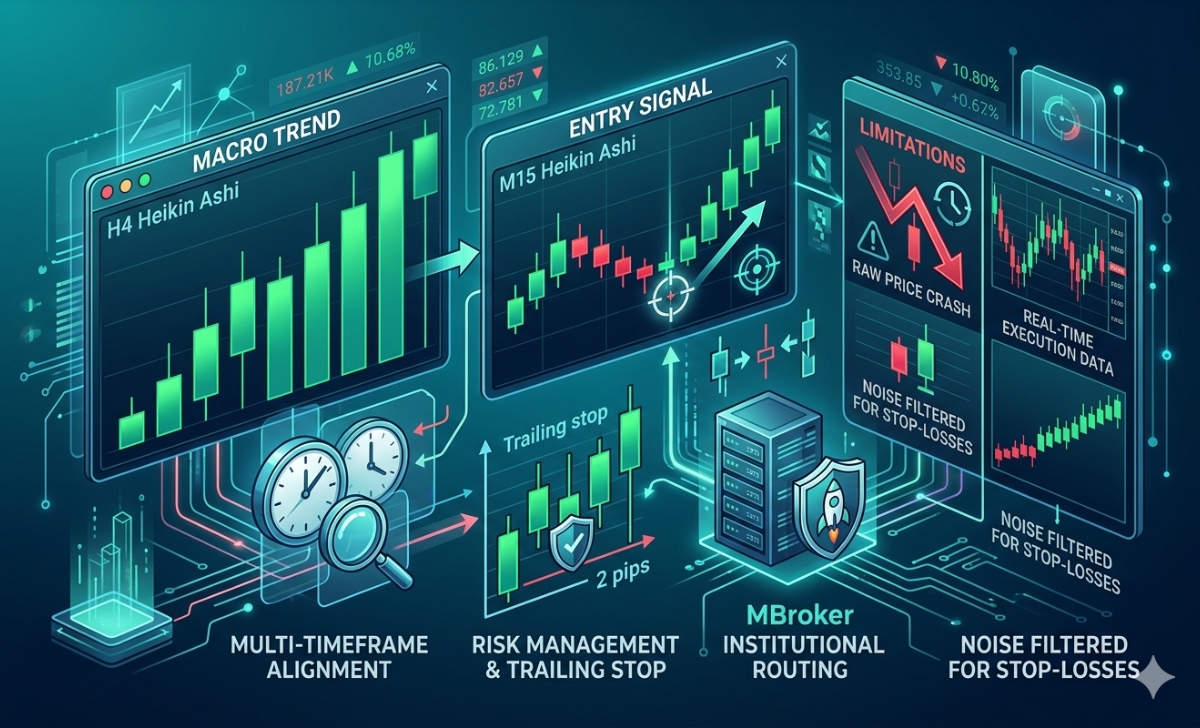
Professional day traders use these modified bars exclusively to manage their active risk and trail their stop-losses, while simultaneously referencing raw Japanese candles to execute their actual market entries. When this balanced methodology is deployed using the competitive institutional routing tools featured on the MBroker, traders can easily capture macro trends while keeping their slippage costs minimal.
How to use Heikin Ashi in a trading strategy?
To execute a professional, rule-based strategy using this charting method, enforce this 4-step institutional framework:
- Step 1: Define the Macro Trend: Open a higher timeframe chart (e.g., H4) and verify that the candles are large, green, and possess completely flat bottoms.
- Step 2: Isolate the Lower Timeframe Entry: Drop down to an execution timeframe (e.g., M15) and wait for a temporary corrective pullback to end, signaled by the candles flipping from red back to green.
- Step 3: Confirm Momentum Acceleration: Ensure the first two green candles on your execution chart feature zero lower wicks, confirming that aggressive institutional buying has officially resumed.
- Step 4: Manage the Position and Trailing Stop: Execute your long position and dynamically trail your stop-loss order exactly 2 pips beneath the flat bottom of the trailing candles as they climb higher.
While this systematic approach provides excellent structural protection, executing it successfully requires managing the unique operational trade-offs of the indicator.
What are the limitations of Heikin Ashi trading?
The primary limitation of Heikin Ashi trading is the mathematical lag embedded within the formula, which can result in delayed entry signals during high-velocity market reversals. Because the opening price of each candle is bound to the midpoint of the previous bar, a sudden, news-driven market crash may drop multiple pips before the modified candle physically flips from green to red. Furthermore, because these charts do not display real-time transaction prices, they are completely unsuitable for high-frequency scalping strategies; to prevent execution mismatches and access advanced multi-timeframe charting tools, ensure you utilize the live data resources available on the MBroker.
In short, Heikin Ashi Candles serve as an exceptional technical tool for smoothing out market noise, managing trailing stops, and keeping your strategy aligned with macro institutional trends. By tracking the presence of opposing wicks, using a multi-timeframe confirmation process, and referencing raw charts for precise entry execution, you can easily remove emotional guesswork from your daily routine.

Thoren Vextal is a specialist in XM trading guides, offering practical insights and real-market experience to help traders improve their strategies and trading performance. Email: [email protected]