
 Tiếng Việt
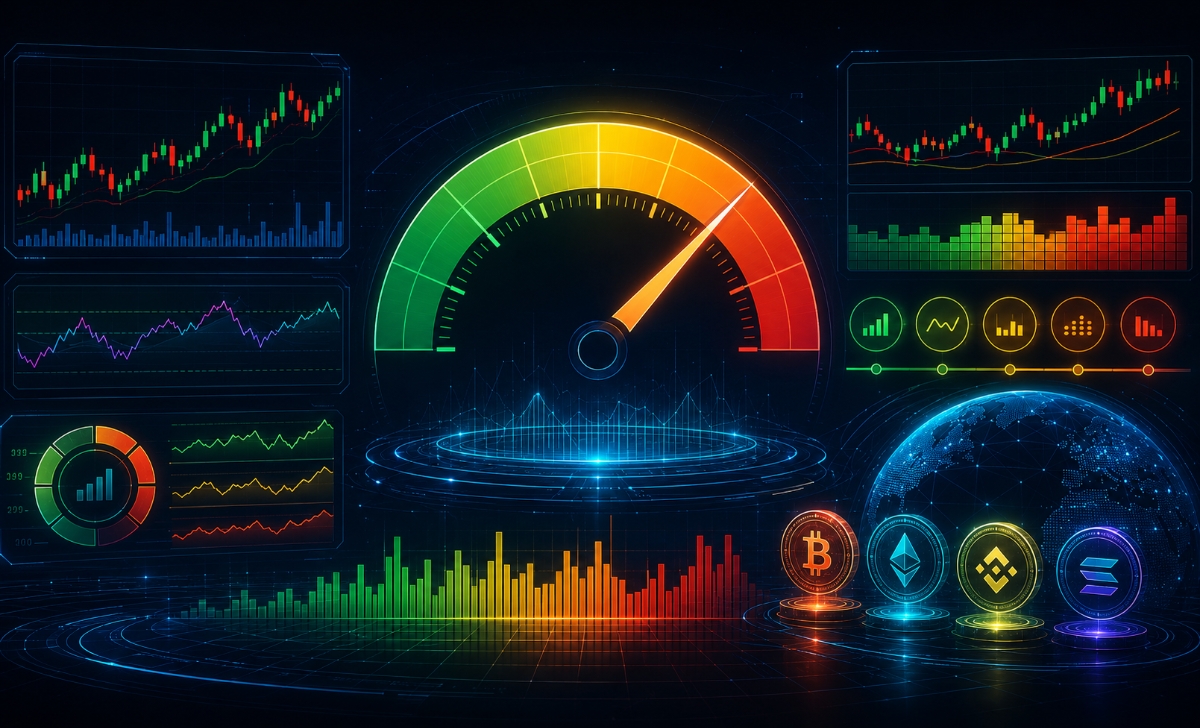
The Fear and Greed Index measures market sentiment from 0–100, where low values signal fear (potential buying zones) and high values indicate greed (potential market tops), making it a key tool for crypto trend and trading signal analysis.
Moreover, market sentiment is reflected through Extreme Fear (panic selling) and Extreme Greed (overbuying pressure), helping traders understand crowd psychology and identify reversal risks in volatile conditions.
Additionally, the index helps identify crypto trends by tracking emotional cycles that often align with accumulation (fear) and distribution (greed) phases, making it highly relevant for timing entries and exits.
Furthermore, Fear and Greed Index acts as a trading signal where low scores suggest buying opportunities and high scores warn of potential corrections, especially when combined with price action or technical indicators.
Finally, effective trading strategies use the index as a confirmation tool rather than a standalone signal, avoiding common mistakes like blindly following extremes without context or broader market analysis.
The Fear and Greed Index is a key tool to understand market psychology, helping traders decode emotional extremes and turn sentiment into actionable insights. Explore more in Forex Technical Analysis to strengthen your trading skills with advanced indicators and real market strategies, powered by MBroker.
What is the Fear and Greed Index and how does it work?
The Fear and Greed Index is a technical sentiment indicator that measures whether specific financial markets are driven by excessive panic or irrational exuberance, operating on a standardized scale from 0 to 100.

Mathematically, a low reading near 0 signals a state of maximum market capitulation, while a high score near 100 reveals peak retail euphoria. By compiling diverse underlying metrics such as transaction volume, price volatility, and social media momentum, this tracking tool provides a clear, real-time snapshot of prevailing emotional extremes across both traditional equity exchanges and decentralized digital asset networks.
What factors are used to calculate the Fear and Greed Index?
The calculation methodology of the index relies on a dynamic composite weight of multiple qualitative and quantitative market variables:
- Market Volatility (25%): Measures current asset price fluctuations compared to the historical 30-day and 90-day averages; sudden spikes in volatility indicate an expanding state of market fear.
- Market Momentum & Volume (25%): Compiles daily buying volume relative to historical averages; heavy buying volume in a vertical uptrend indicates an expanding state of greed.
- Social Media Sentiment (15%): Tracks the speed and volume of specific hashtags and interactions across public networks to gauge retail crowd engagement.
- Market Dominance (15%): Examines whether capital is hiding in low-risk macro assets or speculation-driven micro assets.
- Search Engine Trends (10%): Filters data changes for high-intent search queries to monitor shifting retail public interest.
By combining these diverse data sources into a single unified metric, the indicator assigns a clean classification label to the market.
What do the Fear and Greed Index levels mean?
The composite score of the index is divided into four distinct emotional zones that dictate immediate crowd behavior:
- 0 to 24 – Extreme Fear: Indicates severe institutional capitulation and panic selling, where assets are frequently suppressed deep into undervalued territory.
- 25 to 49 – Fear: Signals a general state of investor caution, low retail volume, and minor capital liquidations.
- 50 to 74 – Greed: Highlights an acceleration of capital inflows, rising speculative activity, and strong upward price momentum.
- 75 to 100 – Extreme Greed: Warns of an unsustainable retail bubble, massive FOMO (Fear of Missing Out), and an imminent macro market reversal.
Recognizing these specific numerical zones allows you to easily identify how crowd psychology influences immediate price action.
How does the Fear and Greed Index reflect market sentiment?
The Fear and Greed Index reflects market sentiment by acting as a psychological mirror that exposes when the collective investing public is behaving irrationally relative to underlying asset valuations.

Historically, financial markets are driven by alternating emotional cycles of expansion and contraction rather than cold mathematical logic, meaning prices frequently overextend far past true intrinsic value. By monitoring the fear and greed index meaning, professional desk operators can easily determine when the retail crowd has pushed an asset to an unsustainable emotional extreme, allowing them to prepare for an inevitable structural counter-move.
What happens during Extreme Fear in the market?
During a phase of Extreme Fear, panic spreading through the retail crowd triggers forced margin liquidations and irrational capitulation selling, which drives the fear and greed index stock and crypto metrics to multi-month lows. Institutional market makers utilize this massive influx of sell orders to quietly accumulate high-quality assets at deep historical discounts. For contrarian investors tracking long-term data trends, an extreme low reading on the fear and greed index today serves as a strong technical signal that the immediate downward pressure has reached an exhaustion point.
While extreme fear uncovers major discount opportunities, the polar opposite phase introduces significant risk to unhedged portfolios.
What risks appear during Extreme Greed?
When the index escalates into Extreme Greed, the market enters a highly unstable state characterized by excessive leverage, retail euphoria, and a complete disregard for systemic downside risk. During this phase, inexperienced retail traders pile into positions at the absolute top of the market cycle due to intense psychological FOMO. This irrational buying pressure hollows out the available liquidity resting on the underlying order book; when institutional whales begin taking profits, this lack of support often triggers a sharp, high-velocity market crash.
To see these emotional cycles play out with maximum velocity, we must shift our focus to the high-stakes world of digital currencies.
How to read crypto trends using the Fear and Greed Index?
Reading crypto trends via the crypto fear and greed index requires identifying the momentum turning points where speculative retail enthusiasm shifts from long-term capital accumulation to sudden, aggressive distribution.

Because the digital asset marketplace is heavily driven by retail social sentiment and continuous 24/7 speculation, its emotional cycles move significantly faster and reach greater statistical extremes than traditional equity markets. Tracking the fear and greed index crypto baseline allows you to separate short-term price noise from structural macro trends, keeping your portfolio perfectly aligned with smart money rotations.
Why is the Fear and Greed Index important in crypto trading?
The index is uniquely important in crypto trading because digital assets lack standard fundamental valuation metrics like price-to-earnings (P/E) ratios or corporate cash-flow statements. Consequently, crypto prices are driven almost entirely by liquid capital flows and collective human momentum, making sentiment tracking a mandatory requirement for navigating the asset class safely. Monitoring the fear and greed index crypto today gives day traders an objective, data-driven anchor that prevents them from chasing dangerous vertical pumps or panicking during healthy technical pullbacks.
By serving as a steady psychological anchor, the indicator becomes a powerful tool for mapping out broader market cycle transitions.
How does the index signal trend cycle in crypto?
The indicator maps out the long-term trend cycle by marking the exact boundaries where structural asset distribution and accumulation take place:
- The Accumulation Floor: When the index remains pinned within the 10–20 range for multiple weeks, it signals a macro market bottom where smart money absorption is actively neutralizing retail panic.
- The Distribution Ceiling: When the index maintains a prolonged reading above 85, it signals a macro market top, warning that speculative buying volume is completely exhausted and a multi-month bear phase is imminent.
Once you can effortlessly read these cyclical patterns, you can transition from passive market analysis to executing explicit, data-driven trading entries.
How to use Fear and Greed Index as trading signals?
To use the Fear and Greed Index as a verified source of trading signals, you must adopt a strict contrarian execution methodology that deliberately trades against the emotional extremes of the retail crowd.

Statistically, the general public buys the absolute top of the market out of greed and sells the absolute bottom out of fear, meaning that executing positions in direct opposition to crowd sentiment yields a significantly higher mathematical probability of success over a large sample size of trades.
Contrarian traders should execute their primary portfolio adjustments when the indicator reaches historical statistical thresholds:
- The Long Buy Signal: When the index drops below 20, execute long positions on your terminal; this indicates that the asset is deeply oversold and trading at a significant psychological discount.
- The Short Sell / Take-Profit Signal: When the index climbs above 80, liquidate open long positions or initiate short entries; this warns that the market is overextended and highly vulnerable to an immediate profit-taking correction.
To safely transition these basic buy and sell thresholds into a professional, live portfolio environment, you must embed them into a comprehensive risk management checklist.
How to apply the Fear and Greed Index in a trading strategy?
Applying the Fear and Greed Index within a professional, live trading strategy requires establishing a strict multi-layered confirmation system that integrates price action, volume analysis, and macro support and resistance boundaries.

Top-tier fund operators never deploy capital based on a single sentiment metric alone; instead, they utilize the index as an initial directional scanner before verifying the trade setup via traditional technical studies. When these optimized sentiment strategies are deployed through premium, low-latency platforms like the one recommended on the MBroker, traders maximize execution precision while keeping transaction friction completely minimized.
What are common mistakes when using the Fear and Greed Index?
The most catastrophic mistake retail day traders make is treating the index as an immediate, timing-based execution trigger. An index score of 85 (Extreme Greed) does not mean you should immediately hit the short button, as rampant market euphoria can easily keep an asset overbought for multiple weeks before a reversal physically materializes. Additionally, many retail traders fail to filter sentiment data across different asset classes; failing to separate traditional equity data from highly volatile altcoin metrics often leads to massive entry miscalculations.
To completely insulate your equity curve from these unforced analytical blunders, you must enforce a strict technical validation checklist.
How to use the index effectively in real trading?
To maximize the predictive accuracy of your sentiment-based trading system, enforce these three strict institutional execution rules:
- Enforce Multi-Timeframe Confirmation: Only execute a contrarian buy signal when the price action concurrently touches a major daily or weekly horizontal support block.
- Integrate Momentum Oscillators: Cross-reference an extreme index reading with the Relative Strength Index (RSI) or MACD lines to ensure a true technical momentum divergence has formed before entering the market.
- Leverage Pristine Data Infrastructure: Reviewing the live market updates and professional sentiment breakdowns featured on the MBroker allows you to cross-verify your technical data against institutional market flows, ensuring your trading execution remains perfectly synchronized with global capital trends.
In short, the Fear and Greed Index is a highly effective technical tool for identifying sentiment extremes, managing portfolio risk, and capitalising on irrational market panics or euphorias. By adopting a contrarian execution framework, waiting for structural technical confirmation at key support or resistance lines, and strictly avoiding trading blindly on raw scores alone, you can easily eliminate costly execution guesswork.

Thoren Vextal is a specialist in XM trading guides, offering practical insights and real-market experience to help traders improve their strategies and trading performance. Email: [email protected]