
 Tiếng Việt
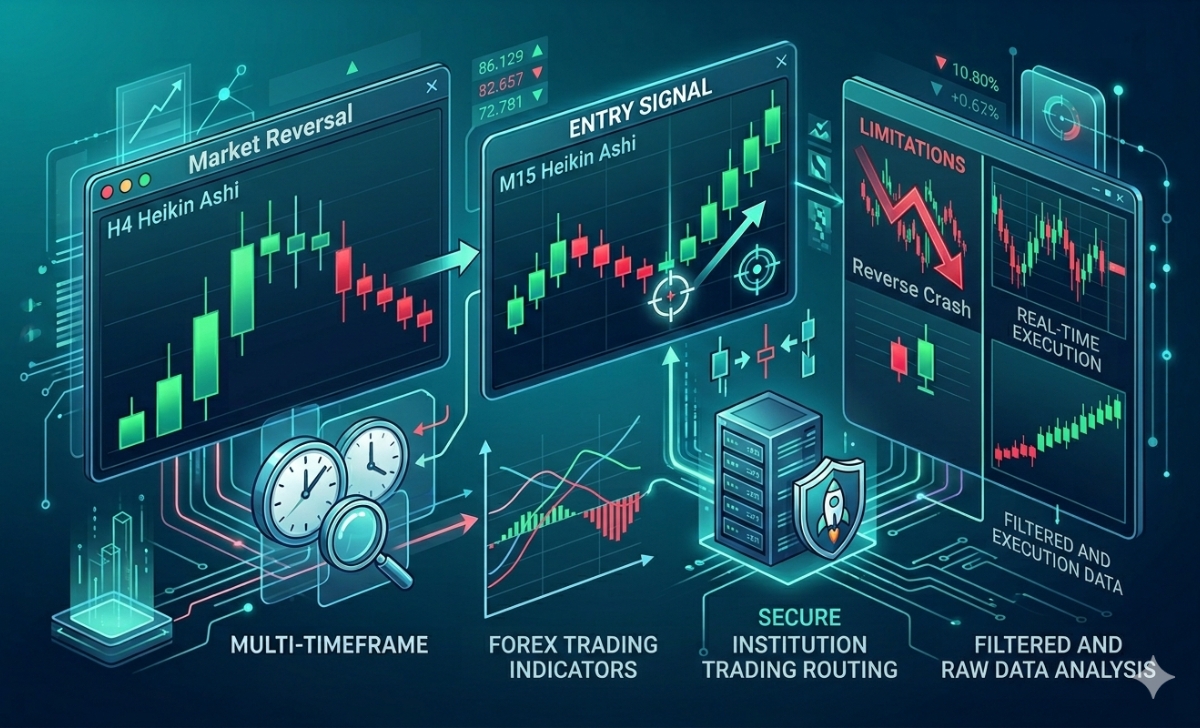
Reversal patterns are chart formations that signal a potential change in trend direction, helping traders identify when a market may shift from bullish to bearish or vice versa.
Moreover, a true market reversal occurs when price structure breaks and forms a new trend direction, often confirmed by higher highs/lows or lower highs/lows.
Additionally, reversal patterns are widely used in forex trading to time entries at key turning points, allowing traders to capture early trend movements with favorable risk-reward.
Furthermore, technical indicators such as RSI, MACD, and volume are used to confirm reversal patterns, increasing the accuracy of trading signals.
Mastering reversal patterns is essential for identifying market reversals and improving trade timing. At Forex Technical Analysis, traders gain practical strategies to combine price action and indicators for more precise forex trading decisions.
Reversal patterns in technical analysis
Reversal patterns are distinct geometric chart formations that signal complete exhaustion of the dominant market trend and the imminent beginning of a new price cycle in the opposite direction.

These setups mark the physical transition of asset control between institutional buyers and sellers, exhibiting a structural win rate of over 65% when identified on higher timeframes like the H4 or Daily charts. By mastering these specific visual formations, retail day traders can systematically pinpoint major market structural changes, protect their existing portfolio capital, and capture highly profitable early entries at the absolute beginning of a new directional trend.
What are reversal patterns in trading?
In active financial trading, a reversal pattern is a localized consolidation structure that proves the prevailing momentum has completely run out of institutional order backing. Unlike continuation setups that suggest a brief market pause, a validated reversal pattern demonstrates that the balance of supply and demand has fundamentally flipped. The most historically reliable examples of these formations include Double Tops, Double Bottoms, Head and Shoulders, and Inverse Head and Shoulders configurations, which present clear, rule-based breakout boundaries for technical traders.
Recognizing the visual appearance of these shapes is merely the first step; you must also comprehend the macroeconomic psychology that forces them onto your screen.
Why do reversal patterns form on the market?
Reversal patterns form on the market because global institutional orders are too massive to be executed instantaneously at a single price point without causing a massive liquidity imbalance. When a major hedge fund or commercial bank decides to liquidate a large multi-million dollar long position, they must distribute their inventory gradually across a specific price range, creating multiple failed attempts to push the market higher (such as the peaks of a Double Top). This systematic distribution process creates recognizable horizontal or dynamic accumulation zones, leaving a clear footprint on your chart that retail traders can easily track.
Once you understand why these distribution blocks form, you can begin analyzing the specific raw price action and behavioral shifts that validate a true macro trend shift.
Market reversal and price behavior behind patterns
A true market reversal represents a fundamental, long-term shift in the underlying directional trend of an asset, characterized by a clean break in the traditional sequence of market structure.

A verified trend change requires price action to violate its established series of higher highs and higher lows (for uptrends) or lower highs and lower lows (for downtrends), replacing it with an opposing structural matrix. This behavioral transition is heavily driven by institutional capital reallocations, causing resting order blocks to dry up and forcing prices to search for fresh liquidity at entirely new valuation tiers.
What defines a true market reversal?
A true market reversal is officially defined by a confirmed technical break in market structure, which must not be confused with a minor short-term corrective pullback. In a healthy bullish market, structure is preserved as long as price maintains its horizontal support boundaries; a macro reversal is confirmed at the exact moment a daily candle closes cleanly below the previous major swing low. This structural violation proves that the institutional buyers who previously protected that specific support floor have completely pulled their buy limits, handing absolute control of the market order book to aggressive sellers.
To prevent yourself from falling victim to false structural breaks, you must analyze how localized candle behavior confirms these major shifts.
How does price action confirm a reversal?
Price action confirms an imminent trend reversal through a highly specific sequence of high-volume candle prints and structural retests:
- The Momentum Shift: The appearance of aggressive, wide-bodied rejection candles (like Bearish Engulfing or Pin Bar formations) at major historical resistance zones.
- The Structural Break: A decisive, high-volume close outside the pattern’s boundary line (such as the Neckline of a Head and Shoulders), violating the established market trend.
- The Retest Verification: Price completes a minor low-volume pullback to the broken boundary line, transforming old support into new technical resistance.
By mastering this structural confirmation loop, you can safely transition to applying these geometric setups within your active daily execution routine.
Applying reversal patterns in forex trading
Applying reversal patterns in forex trading requires executing a strict, rule-based entry protocol that balances rapid order routing with defensive stop-loss placement.

Because the foreign exchange market handles over $7.5 trillion in daily turnover, currency pairs exhibit clean, high-probability structural retests that allow retail traders to trade in perfect alignment with major banking flows. When these geometric setups are applied properly on your terminal, they enable you to filter out daily market noise, lower your execution friction, and optimize your net portfolio yields.
How to trade reversal patterns in forex effectively?
To trade a classic forex chart reversal pattern with high mathematical precision, follow this definitive 4-step institutional framework:
- Step 2: Confirm the Breakout Close: Wait for a specific timeframe candle (such as the H4 or Daily) to close completely outside the pattern’s structural line to confirm the validity of the breakout.
- Step 3: Secure Your Entry Order: Enter your position either immediately upon the breakout candle close or place a limit order at the broken boundary line to capture a premium structural retest.
- Step 4: Establish Your Exit Parameters: Place your protective stop-loss safely beyond the highest peak of the pattern structure and project the vertical height of the pattern to determine your objective take-profit target.
While this framework outlines the macro strategy, executing it flawlessly requires identifying the exact micro-locations where your orders should be placed.
Where to enter trades using reversal patterns?
There are two highly optimized execution entries used by professional desk traders when deploying capital around reversal structures:
- The Aggressive Breakout Entry: Executed the exact second a candle closes outside the pattern’s boundary line, ensuring you capture the initial wave of high-velocity momentum.
- The Conservative Retest Entry: Placed via a limit order at the broken boundary line (e.g., the broken neckline), which dramatically compresses your necessary stop-loss distance and maximizes your net risk-to-reward ratio.
To maximize the mathematical win rate of either entry choice, you should always verify your price action patterns using complementary volume and momentum tools.
Indicators to confirm reversal patterns
Technical indicators serve as a vital quantitative filter that confirms the validity of a chart reversal pattern by exposing hidden momentum divergences and institutional money flow shifts.

Statistically, combining raw price geometry with mathematical oscillators reduces your exposure to costly false breakouts by more than 40%, protecting your account from premature stop-outs during choppy market conditions. When these advanced confirmation tools are paired with the premium execution infrastructure and ultra-low spreads found on the MBroker, traders can easily execute high-probability setups with maximum technical efficiency.
Which indicators work best with reversal patterns?
To automate and secure your structural pattern analysis, you should integrate these three time-tested indicators into your system:
- The Relative Strength Index (RSI): A powerful momentum oscillator used to identify classic overbought ($$>7$$) or oversold ($$<3$$) conditions and detect strong momentum divergences against price.
- The MACD (Moving Average Convergence Divergence): An institutional tool that tracks changes in trend velocity, providing confirmation via signal line crossovers when a pattern breaks out.
- On-Balance Volume (OBV): A cumulative transaction indicator that reveals whether institutional smart money is actively accumulating or distributing capital behind a visible chart pattern.
By embedding these specific tools into your daily workflow, you can easily verify whether a visual chart pattern has genuine financial backing.
How to combine indicators with price action?
To build a highly accurate, institutional-grade execution matrix, combine your indicators with price action using a strict convergence checklist:
- Step 1: Monitor Major Support / Resistance: Ensure your chart reversal pattern prints directly against a major historical daily or weekly horizontal structure zone.
- Step 2: Verify Momentum Divergence: Check your RSI indicator; ensure it displays a clear bullish or bearish divergence against the asset’s price peaks, proving that trend velocity is actively dying.
- Step 3: Wait for the Structural Breakout: Allow price action to physically execute a clean candle close outside the pattern boundary line on high transaction volume.
- Step 4: Confirm via MACD Crossover: Verify that the MACD line executes a corresponding crossover matching your intended trade direction, providing the final algorithmic confirmation needed to safely enter your position.
By cross-referencing your unified indicator checklist with the live platform updates and expert technical resources featured on the MBroker, you can easily ensure your trading system remains perfectly synchronized with global market clocks.
In short, mastering Reversal Patterns is a mandatory skill for accurately timing trend transitions, minimizing execution friction, and securing optimal risk-to-reward metrics. By identifying formations at historical support or resistance zones, waiting for confirmed breakout candle closes, and filtering entries through momentum oscillators like the RSI and MACD, you can easily eliminate costly execution guesswork.

Thoren Vextal is a specialist in XM trading guides, offering practical insights and real-market experience to help traders improve their strategies and trading performance. Email: [email protected]