
 Tiếng Việt
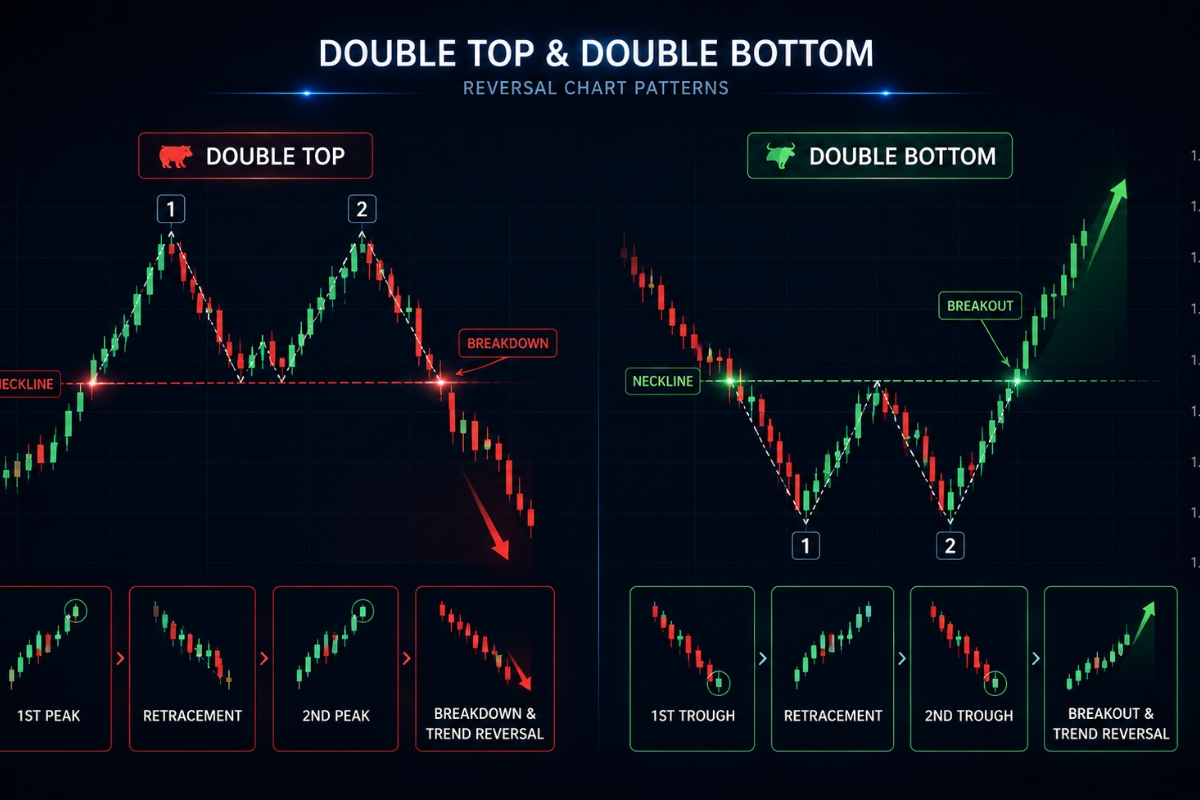
Double top and Double bottom chart patterns are reversal patterns that signal trend changes from bullish to bearish or vice versa, commonly appearing at market tops and bottoms with clear M and W structures.
These patterns form through two peaks (double top) or two troughs (double bottom) with a neckline acting as key support/resistance, confirming structure when price fails to break previous highs or lows.
However, valid signals only occur after a confirmed breakout of the neckline, often supported by volume increase or momentum indicators to avoid false signals.
Additionally, trading involves entering after breakout confirmation, setting stop loss above/below the structure, and targeting profit based on pattern height.
Therefore, effective strategies focus on risk management and combining indicators to improve accuracy, helping traders reduce false breakouts and optimize overall performance.
To trade more effectively, mastering the right knowledge and structured processes is essential. Explore the XM Guide section to better understand how everything works and apply it in real trading.
Double top and bottom chart pattern overview
Double top and bottom chart patterns are reliable technical reversal formations that signal an impending shift in the prevailing market trend. A double top signals a transition from a bullish trend to a bearish one, while a double bottom alerts traders to a bullish reversal following an extended downtrend. Statistically, these patterns display a high success rate across various financial markets because they explicitly map areas where major institutional supply or demand enters the order book.
What is a double top and double bottom pattern?
A double top is a bearish reversal pattern characterized by two consecutive price peaks at roughly the same horizontal level, separated by a structural valley. Conversely, a double bottom is its bullish mirror image, featuring two distinct price troughs hitting a similar low support zone before turning upward. Both structures rely heavily on a critical baseline called the neckline, which represents the transitional support or resistance level that must break to confirm the pattern’s validity.
Beyond simple visual recognition, understanding the mechanical timeline of their formation prevents traders from entering prematurely.
How does the double top bottom pattern form on charts?
The formation of these patterns follows a strict cyclical behavioral journey:
- First Peak/Trough: The market moves aggressively within a strong trend, hitting a temporary extreme level where it meets heavy institutional pushback.
- The Retracement: Price pulls back temporarily due to profit-taking, creating a structural turning point known as the neckline.
- Second Peak/Trough: The dominant trend attempts to resume momentum but fails to push past the first extreme point, signaling that buying or selling pressure is completely exhausted.
- Trend Transition: Price reverses course back toward the neckline, setting up the ultimate breakout sequence.
Once the overall structure is understood, a professional analyst must learn to isolate the precise signals required for official pattern validation.
Double top pattern signals and confirmation factors
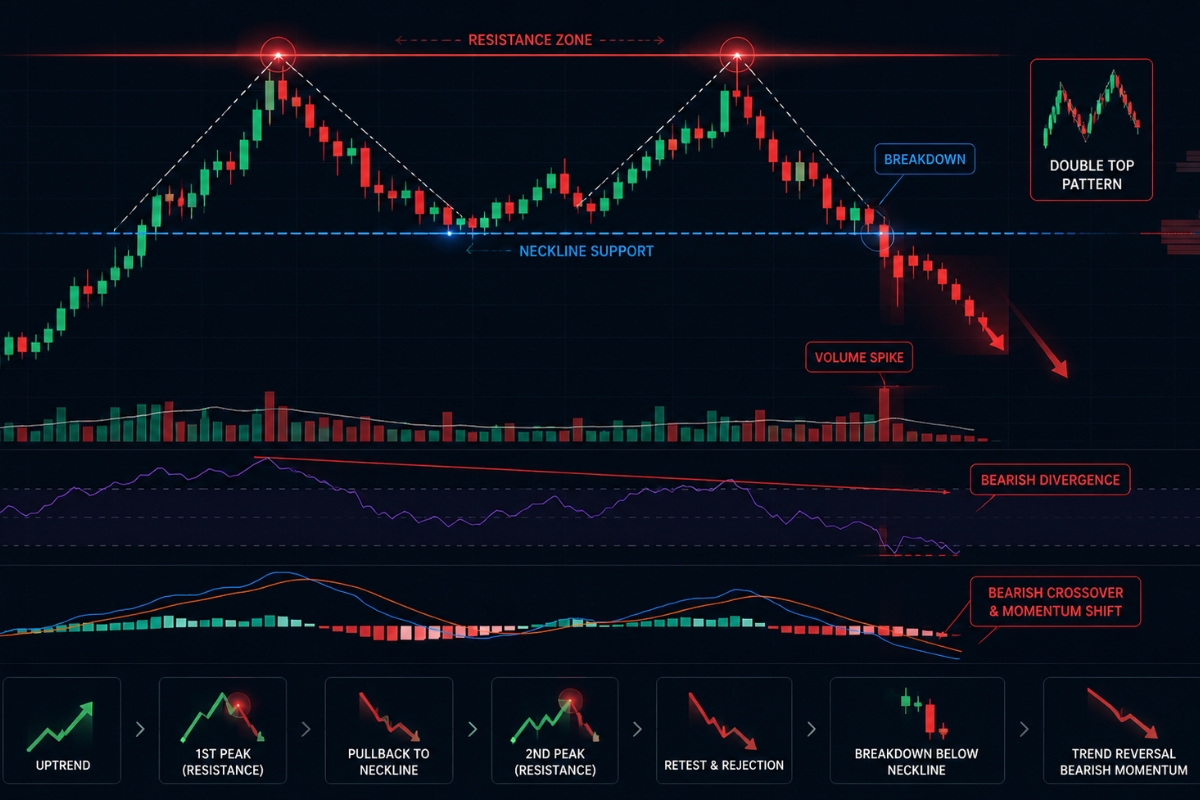
A valid double top pattern develops at the peak of an extended uptrend, signaling that bulls can no longer maintain their upward trajectory. The pattern is officially confirmed only when the price breaks decisively below the neckline support with a closing candle on your chosen timeframe. Entering a trade before this structural violation occurs is highly risky, as the asset could simply be consolidating before continuing its original bullish path.
What confirms a valid double top pattern?
To protect your trading capital, always look for these secondary confirmation variables before executing a short position:
- The Neckline Breakout: A daily or 4-hour candle must close strictly below the support line.
- Volume Expansion: Trading volume should ideally spike during the breakout candle, indicating that institutional selling is driving the breakdown.
- Peak Asymmetry: The second peak is often slightly lower than the first peak, indicating an immediate shift toward lower highs.
- Oscillator Divergence: Technical indicators like the RSI or MACD will frequently show a bearish divergence at the second peak, confirming weakening momentum.
Avoiding common execution traps during this confirmation phase is critical for safeguarding your equity.
What are common mistakes when trading double top?
Many retail traders suffer heavy losses by committing classic errors when interacting with double tops. The most damaging mistake is anticipating the pattern, which involves entering a short position while the second peak is still forming, long before the neckline breaks. Another frequent error is ignoring the broader market context; a double top forming against a hyper-bullish macroeconomic backdrop will often fail and turn into a continuation pattern.
Recognizing these traps in a bearish setup allows us to easily flip our perspective when analyzing a bullish market floor.
Double bottom pattern behavior and reversal signals
A double bottom pattern acts as the foundational structural floor that concludes an extended bearish cycle. This formation illustrates a psychological environment where sellers have exhausted their inventory, and aggressive buyers are stepping in to accumulate positions at wholesale prices. The pattern achieves official confirmation when price breaches neckline resistance, converting that previous ceiling into a reliable support zone for an incoming bull run.

What confirms a double bottom pattern?
Validation of a double bottom structure requires clear evidence that the market has established an unbreakable demand zone.
- Resistance Breach: The primary confirmation is a strong, bullish breakout candle closing above the neckline resistance.
- Volume Profile: Volume should decline on the second trough but expand rapidly as the price rallies up to break the neckline.
- Reversal Candlesticks: The presence of bullish reversal candles (such as Hammer or Bullish Engulfing formations) at the second trough provides strong localized confirmation.
This structural evolution is not random; it is driven entirely by shifts in trader psychology.
How does market psychology shape double bottom patterns?
The shape of a double bottom pattern directly maps the psychological transition from fear to accumulation. At the first trough, panic selling drives the market to a deep discount, where value investors step in to force a temporary bounce. When short-sellers try to push the market down a second time to create a new lower low, their failure to break the previous trough creates an immediate sense of FOMO (Fear Of Missing Out) among buyers, sparking the aggressive breakout that completes the structure.
With both patterns structurally defined, let’s explore the precise, step-by-step mechanical approach to trading them live.
Trading double top and bottom patterns in real markets
Trading these classical formations requires a highly disciplined, systematic approach to ensure you extract maximum profit while taking calculated risks. Amateur traders often trade on raw emotion, but professionals execute their positions based on an immutable sequence of structural rules. By waiting for market confirmation, you remove the guesswork and trade purely on clear structural evidence.

How to trade double top and double bottom patterns step by step?
Follow this definitive step-by-step roadmap and indicator checklist to trade both formations with institutional precision.
- Step 1: Identify pattern formation: Scan your charts for an established uptrend or downtrend that shows signs of stalling, forming two distinct peaks or troughs at a parallel level.
- Step 2: Draw neckline (support/resistance): Locate the intermediate swing low (for double tops) or swing high (for double bottoms) and draw a precise horizontal ray across that level to define your official neckline.
- Step 3: Wait for breakout confirmation: Patience is key. Monitor the asset closely and wait for a full candlestick body to break and close completely beyond your established neckline.
- Step 4: Enter trade after breakout: Execute your entry immediately upon the close of the breakout candle, or place a limit order at the neckline to capture the common “retest” or “throwback” move.
- Step 5: Set stop loss above/below structure: For a double top, position your Stop Loss safely above the second peak structure. For a double bottom, place it just below the lowest point of the second trough.
- Step 6: Set take profit based on pattern height: Measure the absolute vertical distance from the peak to the neckline. Project this exact distance outward from the breakout point to establish your mathematical Take Profit target.
While price action alone is powerful, backing up your steps with secondary technical tools can dramatically reduce false signals.
What indicators support trading double top patterns?
To filter out false breakouts, professional traders combine price structures with momentum and volume tools. The Relative Strength Index (RSI) is highly effective for spotting momentum exhaustion via bearish divergences.
Additionally, using Moving Average Convergence Divergence (MACD) histogram shifts can confirm when a trend’s velocity is rolling over. For clients aligning their setups with Forex Technical Analysis, combining these standard tools with real-time volume profiles yields a massive structural advantage.
Once execution is mastered, long-term survival relies entirely on how you optimize your risk metrics over time.
Strategy optimization and risk management for double patterns
Strategy optimization is what transforms a basic chart pattern into a scalable, long-term business model. Even the most accurate chart pattern will occasionally fail due to unexpected economic news or sudden liquidity sweeps. Therefore, preserving your trading capital through strict position-sizing and advanced risk management protocols is mandatory to ensure that a few losing trades never wipe out your monthly profits.

How to manage risk when trading double top bottom patterns?
Proper risk management when interacting with these reversal patterns requires a fixed, mathematical approach:
- Strict Capital Allocation: Never risk more than 1% to 2% of your total account equity on a single chart pattern setup.
- Minimum Risk-to-Reward Ratio: Ensure your target distance provides at least a 1:2 Risk-to-Reward (R:R) ratio, meaning your potential profit is always double your defined risk.
- Trailing Stop Execution: Once the market moves 50% of the way toward your Take Profit target, trail your Stop Loss to break-even to guarantee risk-free trade.
Beyond basic capital protection, you can deliberately filter your entries to maximize your strategy’s win rate.
How to improve accuracy in double top trading strategies?
To elevate the accuracy of your double top and bottom setups, only accept trades that fulfill elite conditional filters. First, prioritize patterns that develop on higher timeframes (such as the 4-Hour or Daily charts), as these carry significantly more institutional weight than lower-tier 5-minute noise.
Second, ensure the pattern aligns with a major historical support or resistance zone on the weekly chart. By filtering your trades through the educational parameters championed by MBroker, you can actively avoid low-probability traps and trade with absolute confidence.
In conclusion, Double Top and Bottom Chart Patterns remain cornerstones of technical analysis due to their timeless structural logic and clear reflection of market psychology. By remaining patient, waiting for verified neckline breakouts, and applying strict risk parameters, you can build a highly profitable trading edge.

Thoren Vextal is a specialist in XM trading guides, offering practical insights and real-market experience to help traders improve their strategies and trading performance. Email: [email protected]