
 Tiếng Việt
Trend indicators identify market direction and help traders follow ongoing price trends, making them essential tools in forex trading.
Moreover, trend indicators generate forex signals through crossovers and price alignment, allowing traders to spot entry and exit opportunities.
Additionally, trend indicators detect bullish, bearish, and sideways market trends, helping traders understand overall market structure and direction.
Furthermore, popular trading tools like Moving Average, MACD, and Ichimoku are based on trend indicators, providing structured analysis for decision-making.
Mastering trend indicators is key to capturing market trends and improving trading accuracy. At MBroker, traders gain practical knowledge to apply these tools effectively in real forex markets.
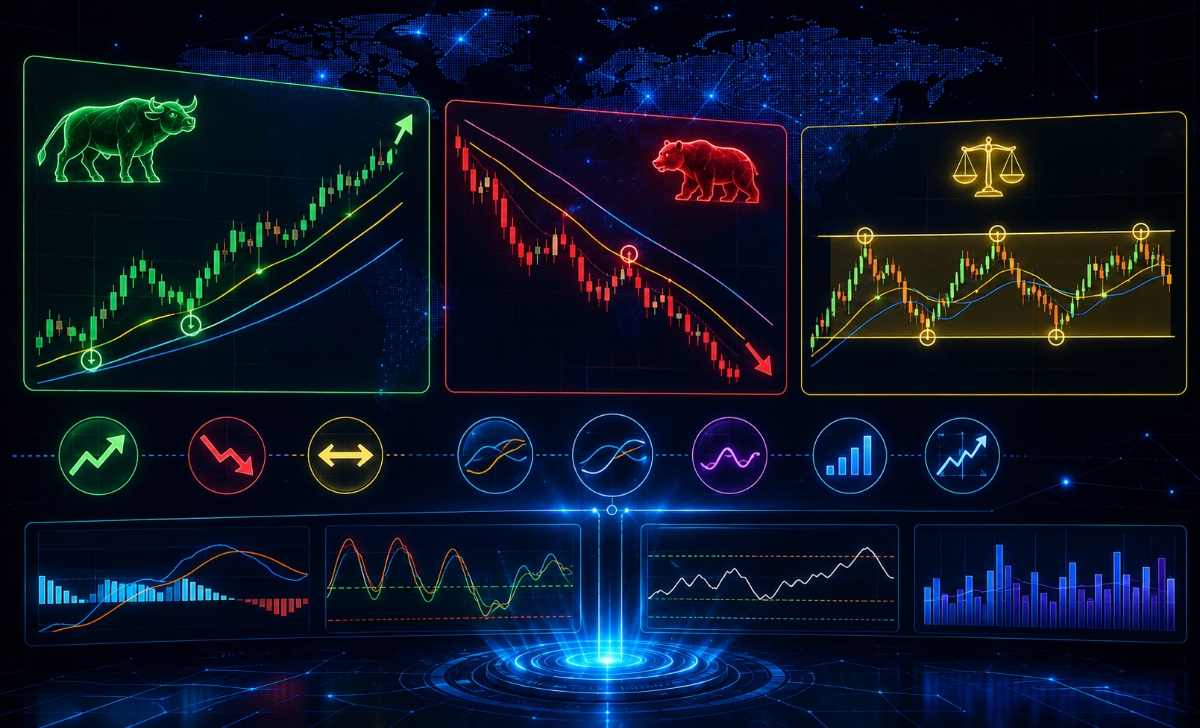
Trend indicators in forex trading
Trend indicators are mathematical calculus tools that smooth out volatile price action data over specific time parameters to identify the baseline directional momentum of a currency pair.

Retail research indicates that over 70% of total global forex market volume is driven by algorithms operating on trend-following logic, making these mathematical overlays indispensable for modern portfolio risk management. By filtering out erratic intraday market noise, these tools establish an objective, data-driven framework that enables retail day traders to align their capital allocation with dominant institutional order flows.
What are trend indicators and how do they work?
Trend indicators are statistical formula overlays that process historical price data—specifically opening, closing, high, and low coordinates—and display them as fluid lagging or leading lines directly on your technical display. They function by averaging out localized market fluctuations over an exact number of periods (such as a 50-day or 200-day window) to reveal the broader macro-directional equilibrium. When price consistently maintains a position above an indicator’s tracking line, the mathematical model confirms a stable underlying demand curve.
Recognizing how these lines process raw pricing data highlights their critical functional value in professional capital preservation.
Why are trend indicators important in forex trading?
Trend indicators are exceptionally important in forex trading because they prevent retail traders from making the catastrophic error of fighting institutional market momentum. Because the foreign exchange market is a decentralized network moving over $7.5 trillion daily, attempting to pick tops or bottoms without statistical validation leads to rapid account drawdowns. These specialized tools provide clear, non-emotional boundaries for stop-loss placements, calculate exact entry zones, and verify whether a localized counter-trend move is an actual market reversal or merely a temporary pullback.
Once you understand their structural value, you can leverage these mathematical boundaries to extract systematic entry and exit triggers.
Forex signals generated by trend indicators
Forex signals generated by trend indicators are actionable execution alerts that manifest when an asset’s live price interaction or a moving line crossover confirms an immediate shift in directional velocity.

Statistically, cross-session backtesting demonstrates that standard trend-following signals yield a significantly higher profit-factor when deployed during active, high-volume trading windows than during flat, quiet consolidation phases. These quantitative triggers remove subjective human hesitation from your daily workflow, ensuring that every position you open is backed by real-time price acceleration metrics.
How do trend indicators generate forex signals?
Trend indicators generate execution signals primarily through structural crossovers, price-line interactions, and historical slope changes:
- The Moving Average Crossover: A fast-moving tracking line cuts cleanly through a slower baseline (e.g., a 50-period crossing a 200-period line), signaling an immediate macro shift in momentum.
- Price Breakout Support/Resistance: The live candle price aggressively closes past a dynamic trailing indicator band, confirming a valid technical breakout.
- Slope Deviation: The physical angle of an indicator line shifts from a flat horizontal plane to a sharp upward or downward trajectory, signaling an influx of institutional volume.
To maximize your long-term win-rate, you must isolate the specific indicator frameworks that offer the cleanest historical data fidelity.
Which trend indicators provide the most reliable signals?
The highest data reliability is consistently achieved by utilizing three foundational trend indicators:
- The Exponential Moving Average (EMA): Unlike simple moving averages, the EMA applies a higher mathematical weight to the most recent price bars, providing fast, highly responsive breakout signals.
- The Ichimoku Kinko Hyo: A comprehensive five-line system that maps out current trend direction, dynamic support floors, and future volatility boundaries simultaneously.
- The Average Directional Index (ADX): A specialized non-directional oscillator that measures the absolute velocity or strength of a trend on a scale from 0 to 100, filtering out dangerous, low-volume false signals.
Understanding how these specific signals function allows you to transition into the next critical step: mapping out broader market conditions.
Market trends and how indicators identify them?
Market trends represent the directional journey of an asset’s price action over an extended period, which indicators identify by calculating the structural sequence of local swing highs and swing lows.
Financial assets spend roughly 30% to 35% of their annual calendar time locking into sustained, linear directional trends, while spending the remaining periods trapped inside horizontal ranges. Correctly utilizing indicators to classify these distinct structural market cycles allows professional day traders to quickly deploy the exact tactical approach suited for the current order-flow environment.
What are the types of market trends?
The global financial landscape moves continuously through three primary structural phases:
- The Uptrend (Bullish Market): Defined by a sequence of ascending higher highs and higher lows, proving that buyers are aggressively absorbing all overhead supply.
- The Downtrend (Bearish Market): Characterized by a steady cascade of lower highs and lower lows, signaling persistent institutional liquidation.
- The Sideways Trend (Ranging/Consolidating Market): A flat environment where price bounces horizontally between fixed support and resistance ceilings, reflecting a temporary equilibrium between buyers and sellers.
To safely navigate these varying phases, an analyst must understand how technical tools verify the actual momentum driving the trend.
How do indicators detect trend strength and direction?
Indicators calculate direction by checking if price candles are holding above or below a moving mathematical average, and they detect trend strength by measuring the structural distance between those lines. For instance, when a currency pair locks into an aggressive uptrend, the gap between the 10 EMA, 20 EMA, and 50 EMA will expand rapidly, indicating powerful directional acceleration. Furthermore, if the auxiliary ADX line climbs over the critical 25 baseline, it provides mathematical confirmation that the current market trend possesses sufficient volume to sustain its breakout trajectory.
Once you know how indicators identify these macro cycles, you can assemble them into a practical suite of execution tools.
Trading tools based on trend indicators
Trading tools based on trend indicators are integrated technical charting packages and trailing volatility channels that establish definitive horizontal or dynamic boundaries for real-time risk management.

Statistically, using a multi-layered trading tool allows an investor to establish an explicit “if-then” execution process, lowering emotional trade management errors by up to 40%. These algorithmic tools function as advanced visual roadmaps, allowing you to instantly isolate optimal trailing stop-loss coordinates and realistic multi-tier profit targets across any live chart.
What are the most popular trend indicator tools?
The most widely implemented technical trend tools utilized across modern institutional desks include:
- Bollinger Bands: A volatility channel consisting of a 20-period simple moving average paired with two standard deviation bands that expand and contract based on real-time market velocity.
- The Parabolic SAR (Stop and Reverse): A dots-based trailing indicator that prints above or below price candles to pinpoint exact trend reversal thresholds and trailing exit coordinates.
- Moving Average Convergence Divergence (MACD): A momentum oscillator that tracks the changing relationship between two EMAs to deliver early-warning validation of upcoming trend developments.
While each of these tools is exceptionally powerful independently, professional execution requires combining them into a unified technical filter.
How to combine multiple trend indicators effectively?
To combine multiple trend indicators effectively without causing analysis paralysis, you must build a strict confirmation matrix using tools that measure different data profiles. A professional combination involves pairing a directional tracking tool (like the 50-period EMA) with a strength measurement tool (like the ADX) and a volatility channel (like Bollinger Bands). By ensuring your system only triggers a trade when the 50 EMA points upward, the ADX sits above 25, and price rides the upper Bollinger Band, you create a high-probability filter that completely shields your capital from erratic false signals.
To access these advanced multi-indicator configurations on unmanipulated price feeds, you must implement them on a highly optimized charting platform.
Using trend indicators on MT4 and MT5 platforms
Using trend indicators on MetaTrader 4 (MT4) and MetaTrader 5 (MT5) platforms requires executing a systematic installation process, setting up automated templates, and calibrating your indicator input parameters to match your specific asset class.

Over 85% of international retail order volume passes through the MetaTrader ecosystem due to its open-source scripting architecture, which easily supports complex multi-timeframe indicator scripts. When you execute these systems via institutional routing speeds and ultra-tight spreads highlighted in the XM Guide, you maximize your technical indicators’ accuracy while completely eliminating execution delays.
How to use trend indicators on MT4 and MT5?
To seamlessly deploy your trend analysis tools on MT4 or MT5, execute this strict 4-step terminal routine:
- Open the Navigator Window: Launch your platform, press CTRL + N to open the Navigator panel, and locate the folder labeled “Indicators” followed by “Trend.”
- Apply Your Indicator: Click and drag your preferred tool (e.g., Moving Average) directly onto your active currency pair chart.
- Configure Parameters: In the pop-up properties window, input your specific period length, calculation method (Simple or Exponential), and visual color layout.
- Save Your Master Template: Right-click anywhere on your configured chart, select “Templates,” then “Save Template,” naming it “Trend Strategy” to instantly apply this exact technical setup to any other currency pair.
Once your platform architecture is fully operational, you must optimize your numerical settings to prevent lagging data from skewing your risk parameters.
What settings work best for trend indicators?
The optimal numerical settings for your indicators are dictated entirely by your target trading style and holding timeframes:
- For Intraday Scalping (M5/M15): Deploy a combination of the 9 EMA and 21 EMA to capture ultra-fast, high-velocity session breakouts.
- For Swing Trading (H4/Daily): Utilize the 50-period EMA as your primary structural pullback entry zone, paired with a standard 14-period ADX to audit trend validity.
- For Macro Portfolio Tracking: Standardize your primary long-term chart layout with the 200-period SMA, which serves as the definitive global line in the sand separating structural bull markets from macro bear markets.
In short, mastering Trend Indicators is an absolute requirement for isolating high-probability forex signals, calculating true market trends, and maximizing the utility of your charting tools. By combining responsive EMA crossovers, filtering your entries through the ADX strength index, and deploying optimized templates on MT4 or MT5, you can easily remove emotional guesswork from your portfolio execution. To continually track real-time trend signals, download premium algorithmic tools, and trade on raw institutional feeds, start your next trading session directly on the MBroker.

Thoren Vextal is a specialist in XM trading guides, offering practical insights and real-market experience to help traders improve their strategies and trading performance. Email: [email protected]