
 Tiếng Việt
Parabolic SAR identifies market trends by plotting dots above or below the price, where dots below indicate an uptrend and dots above signal a downtrend.
However, Parabolic SAR signals are generated when dots flip positions relative to price, indicating potential buy or sell opportunities, though reliability depends on market conditions.
Therefore, traders typically enter trades when SAR dots flip in the direction of the new trend, using the indicator as a timing tool rather than a standalone entry signal.
Additionally, a basic Parabolic SAR strategy involves following trend directions and using SAR as a trailing stop, allowing traders to lock in profits and exit when the trend reverses.
Combining Parabolic SAR with ADX improves accuracy by confirming trend strength, where ADX above 20–25 validates signals and helps filter out false entries in weak markets.
In technical analysis, the Parabolic SAR is one of the popular indicators used to identify trends and reversal points. You can refer to the detailed instructions in the XM Guide section to improve your trading skills.
Parabolic SAR indicator and trend identification
The Parabolic SAR indicator identifies market trends by plotting a series of mathematical dots either above or below the asset’s price chart.
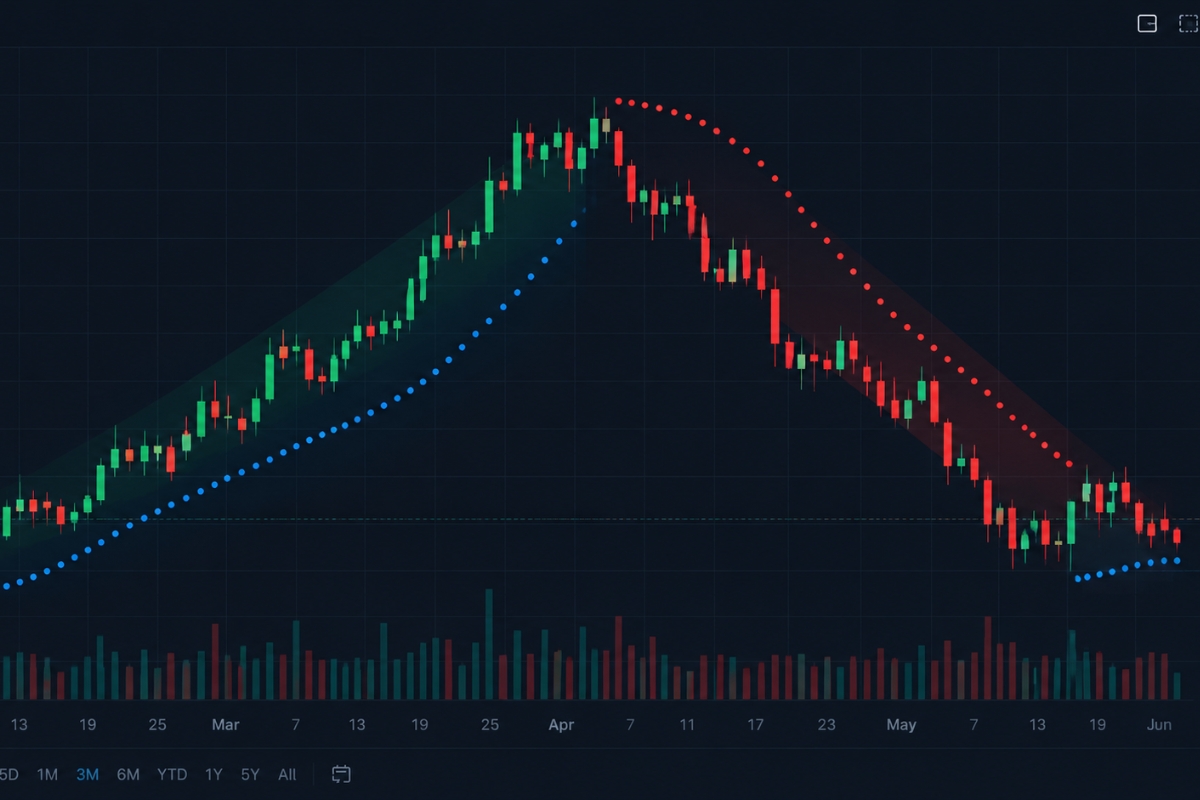
When the dots are located below the price candles, the market is structurally in an uptrend, whereas dots printed above the price indicate a dominant downtrend. Statistically, the indicator functions with an acceleration factor starting at 0.02 and increasing by 0.02 each time the market hits a new high or low, capping out at a maximum value of 0.20 to ensure the indicator moves closer to the price action as a trend matures.
What is Parabolic SAR and how does it work?
The Parabolic SAR, created by legendary technician J. Welles Wilder Jr., is a technical charting overlay designed to determine trend direction and measure momentum exhaustion. The term “SAR” stands for Stop and Reverse, meaning that when the indicator is breached by price, the old trade is technically closed and a new one in the opposite direction is initiated. It relies on a time-price system, meaning that even if the price does not reverse, the dots will automatically crawl closer to the price over time, forcing the trader to tighten risk rules.
Understanding this dynamic movement allows us to map out how the indicator defines broader market phases.
How does Parabolic SAR define market trends?
The indicator defines market trends through a binary, visual layout that eliminates emotional bias from chart analysis:
- Bullish Trend Phase: Price candles trade above the Parabolic dots. The dots slope upward quadratically, mimicking a parabola, which indicates that buyers are actively driving the asset’s momentum.
- Bearish Trend Phase: Price candles trade below the Parabolic dots. The dots slope downward, confirming that sellers maintain systemic control over the order book.
Recognizing these foundational trend phases allows us to look for the precise structural signals needed to execute a trade.
Signals and trading interpretation Parabolic SAR
Parabolic SAR signals occur during a “dot flip,” which represents a sudden shift in short-term market momentum.

A valid trading signal is generated at the exact moment a candlestick touches or breaches an active SAR dot, causing the entire dot series to instantly disappear from one side of the chart and reappear on the opposite side. Because this indicator is highly sensitive to price action, learning to interpret these sudden structural flips prevents traders from entering late into an exhausted trend cycle.
What is a Parabolic SAR buy signal?
A Parabolic SAR buy signal is triggered when the asset price rallies and breaks above a dot series that was previously printed above the candles. Upon this breach, the system calculates the lowest point of the prior downtrend and plots the first new dot below the price candle. This structural shift highlights that bearish momentum has broken down, providing a mechanical green light for long positions or short-coverings.
While the visual trigger is highly absolute, its overall performance varies depending on broader structural market variables.
How reliable are Parabolic SAR signals?
The reliability of a Parabolic SAR signal is entirely dependent on whether the underlying asset is in a trending or ranging phase.
- In Trending Markets: The indicator boasts a historical reliability rate of over 65% to 70%, keeping traders locked into massive directional moves while preventing premature exits.
- In Ranging/Sideways Markets: Reliability drops significantly, as the price oscillates back and forth, creating rapid “whipsaws” or false signals that can quickly erode a trading account through successive minor losses.
Acknowledging this limitation leads to the critical discipline of perfecting your precise entry execution window.
Entry timing using Parabolic SAR in trading
Entry timing using Parabolic SAR requires strict patience, as professional execution mandates entering a trade immediately on the very first or second dot of a new trend sequence.
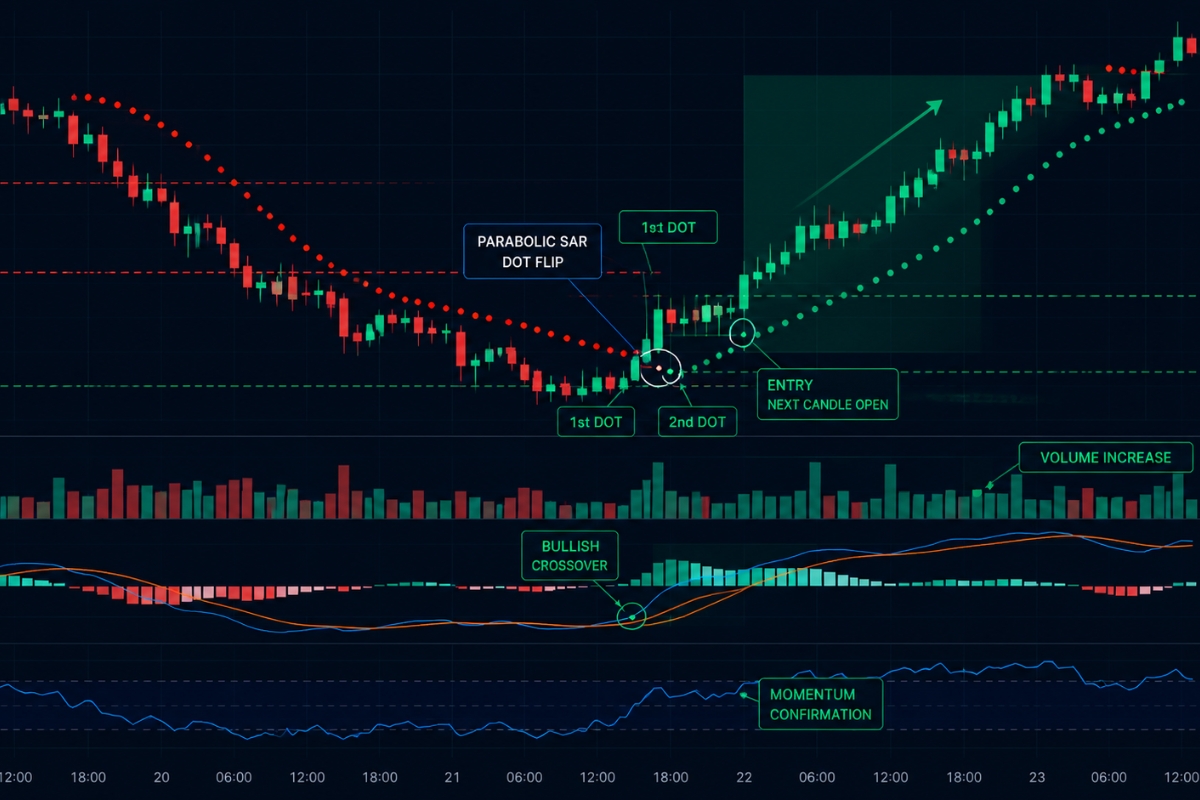
Entering a market after the Parabolic series has already printed 5, 8, or 10 consecutive dots is highly risky, as the acceleration factor has likely pushed the indicator closer to the price, increasing the probability of a market pullback. By mastering the exact moment of a momentum flip, you ensure your initial risk parameters remain as tight as possible.
When should traders enter based on SAR signals?
Traders should enter a position immediately upon the close of the candlestick that caused the Parabolic dot to flip. For example, if a daily candle closes and a new dot appears below the price floor, a long position should be initiated at the open of the next candle. This entry approach guarantees that you are capturing the trend at its absolute birth stage, maximizing your potential upside.
However, executing trades purely based on a single visual indicator is an entry method that professionals avoid.
Should Parabolic SAR be used alone for entry?
No, the Parabolic SAR should never be used alone for trade entry because it lacks a directional strength filter, meaning it will signal buy and sell setups even during dead, flat markets. To protect your equity, you must combine it with volume bars, horizontal support zones, or momentum oscillators to verify that a genuine market trend is present. Experienced analysts at MBroker strongly emphasize using a multi-indicator confirmation matrix to insulate your portfolio from sudden false breakouts.
With these entry principles firmly established, let’s look at the exact step-by-step roadmap for a complete live market strategy.
Parabolic SAR trading strategy in real markets
A successful Parabolic SAR trading strategy transforms the indicator from a simple charting tool into a fully automated, rule-based business model.

This strategy leverages the system’s dual ability to act as both an entry trigger and an ever-tightening risk management floor. By applying mathematical discipline to your exits, you allow your winning trades to compound while automatically cutting your losses short when a trend suddenly breaks down.
What is a basic Parabolic SAR trading strategy?
To better understand how traders apply this indicator in practice, it’s important to explore the fundamentals of a basic Parabolic SAR trading strategy. This approach focuses on identifying trend direction and potential reversal points, helping traders make clearer entry and exit decisions in the market.
- Step 1: Identify trends using SAR dots: Scan your charts to locate an asset where the Parabolic dots are displaying a clear, steady slope on a significant timeframe (such as the 4-Hour or Daily chart).
- Step 2: Wait for signal (dot flip): Monitor the price action patiently until a candle cuts through the existing dots, forcing a momentum flip to the opposite side.
- Step 3: Enter trade in trend direction: Execute your trade entry immediately upon the close of the breakout candle, following the directional path established by the new dot.
- Step 4: Use SAR as trailing stop: As the trade moves in your favor, manually adjust your Stop Loss level to match the price of each new Parabolic dot that prints with every incoming candle.
- Step 5: Exit when trend reverses: Maintain your position until the price turns back and hits your trailing stop, executing a clean exit as the dots flip in the opposite direction.
While these core rules remain constant, the speed of execution must be adjusted depending on the specific asset class you are trading in.
How is Parabolic SAR used in forex and crypto?
The application of this strategy changes based on the liquidity and volatility profiles of the underlying markets:
- In Forex Markets: The indicator is highly effective on major pairs (like EUR/USD or GBP/USD) during the London and New York session overlaps when steady, volume-backed trends are frequent.
- In Cryptocurrency Markets: Due to the extreme, 24/7 volatility of assets like Bitcoin or Ethereum, Parabolic parameters are often widened (e.g., setting the maximum step to 0.15) to prevent getting prematurely knocked out of an exponential bull run by minor intra-day corrections.
To maximize your strategy’s win rate across both markets, we must integrate a secondary tool to measure trend intensity.
Combining Parabolic SAR with ADX for better accuracy
Combining Parabolic SAR with the Average Directional Index (ADX) represents an elite technical strategy that resolves the indicator’s core vulnerability by filtering out low-momentum, ranging market conditions.
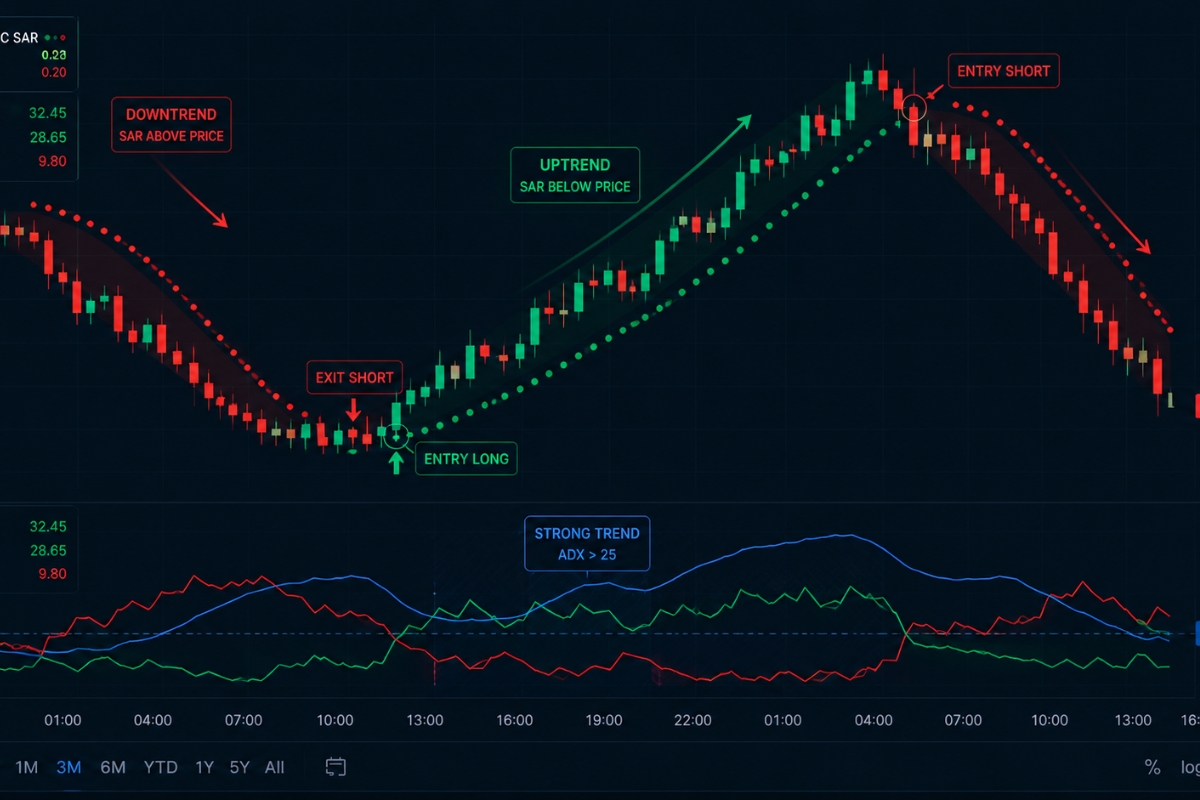
The ADX measures the absolute strength of a trend on a scale from 0 to 100, completely independent of market direction. By only accepting Parabolic SAR signals when the ADX confirms a strong trend is active, you filter out low-probability whipsaws and focus your capital exclusively on high-velocity market moves.
How does Parabolic SAR and ADX strategy work?
This strategy operates on a strict conditional filter system that requires both indicators to flash a green light before any capital is put at risk:
- Trend Strength Check: Monitor the ADX line; a value above 25 confirms a strong, sustainable trend is active, while a value below 20 warns of a flat market.
- Directional Execution: Once the ADX is above 25, look at the Parabolic SAR. If the dots flip below the price, enter a long position; if they flip above, enter a short position.
This simple filter, frequently detailed across the financial educational libraries at MBroker, can increase a trend-following system’s net win rate by up to 20% to 25%.
| Indicator | Condition for Entry | Market Role |
| ADX | Value $> 25$ | Trend Strength Filter (Volatily Check) |
| Parabolic SAR | Dot Flip (First or Second Dot) | Directional Trigger & Trailing Stop |
Finally, mastering this combination requires a clear understanding of when to entirely step away from the terminal.
When should traders avoid using SAR signals?
Traders must avoid using Parabolic SAR signals whenever the ADX line drops below 20, or when the price action is trapped inside a clear, horizontal consolidation box. Furthermore, during high-impact macroeconomic events—such as a US Federal Reserve interest rate decision—the extreme, multi-directional price spikes will render the trailing dots useless, leading to rapid, consecutive stop-outs. Protecting your capital means recognizing when the market environment is no longer compatible with your geometric tools.
In conclusion, the Parabolic SAR remains an invaluable asset for trend-following traders, providing an absolute, emotionless framework for tracking market direction and managing risk. By waiting for valid dot flips, executing early in the cycle, and filtering your entries using the ADX strength index, you can effectively isolate high-probability trend waves while protecting your trading equity.

Thoren Vextal is a specialist in XM trading guides, offering practical insights and real-market experience to help traders improve their strategies and trading performance. Email: [email protected]