
 Tiếng Việt
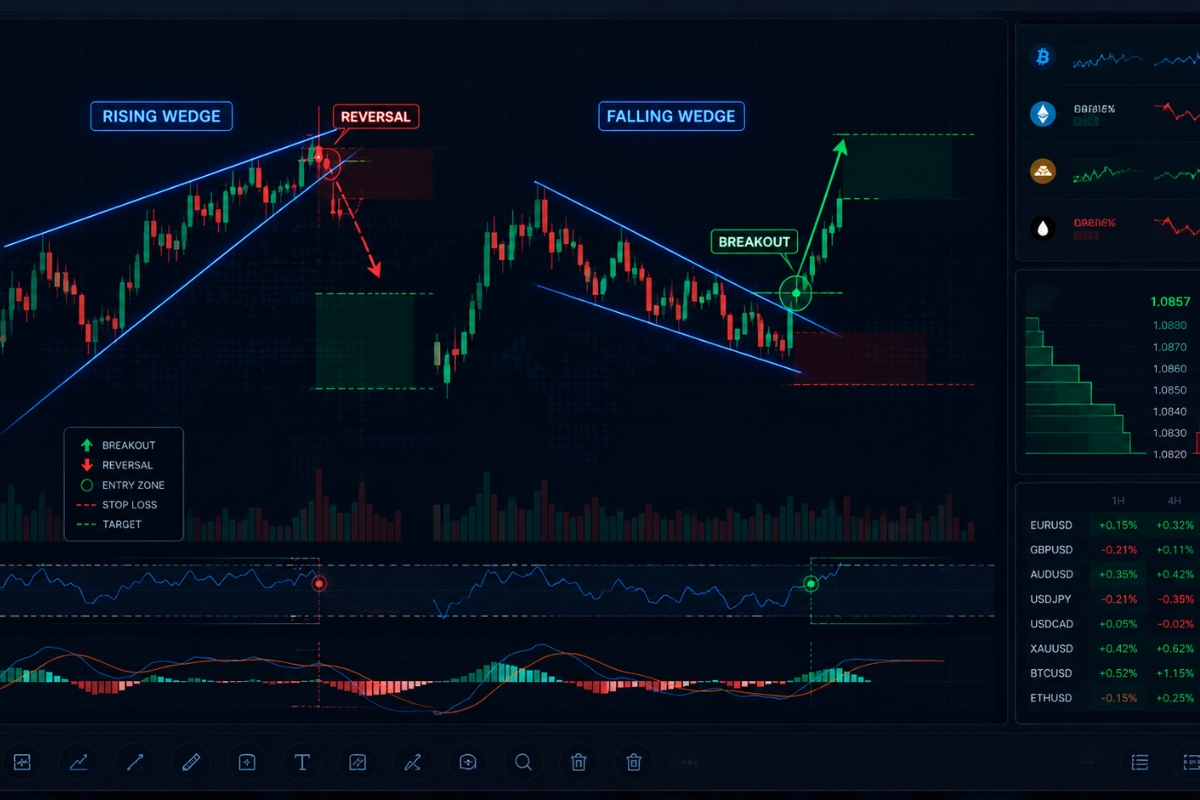
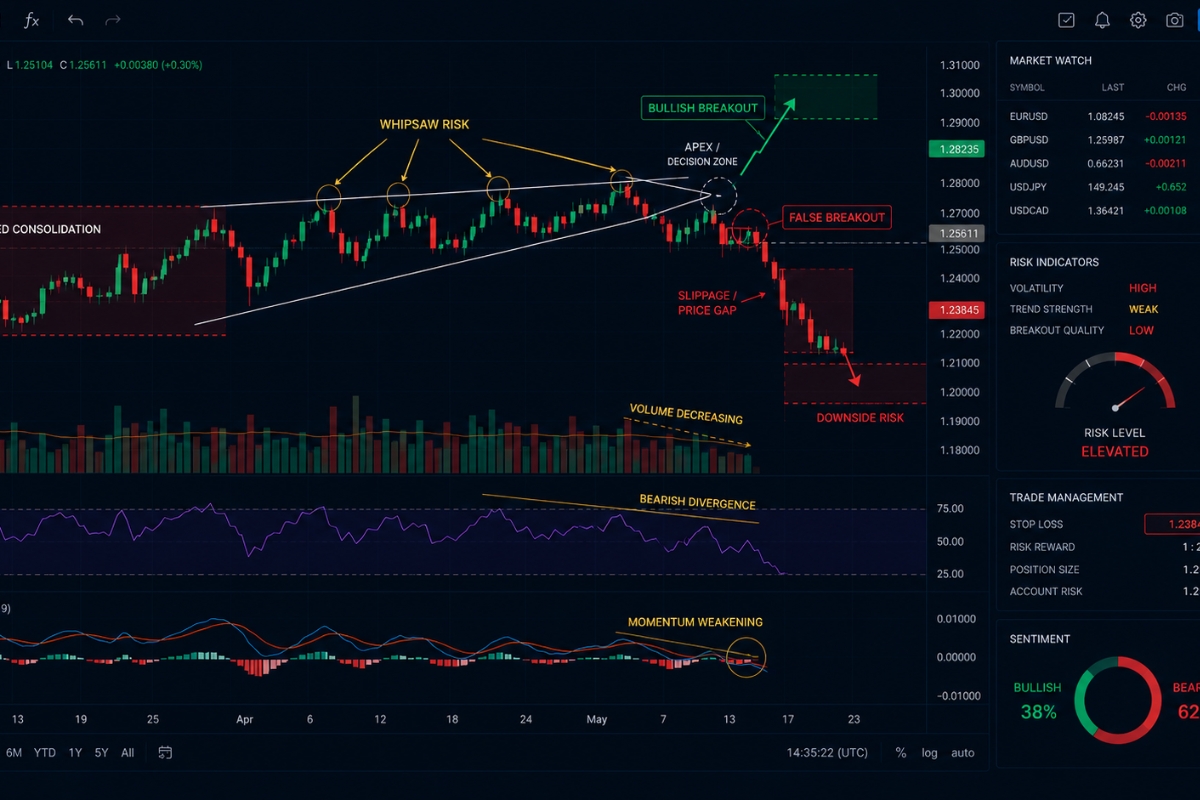
Wedge pattern breakout occurs when price breaks out of converging trendlines with strong momentum, signaling a potential continuation or reversal depending on the prior trend and volume confirmation.
However, wedge patterns often indicate reversal, with rising wedges typically bearish and falling wedges bullish, reflecting weakening momentum before a trend change.
Additionally, valid wedge trading signals are confirmed by volume increase, breakout direction, and retest behavior, helping traders avoid false entries and improve accuracy.
The main risks in wedge pattern trading include false breakouts and market noise, which can lead to losses if traders enter before confirmation or ignore stop loss levels.
Therefore, an effective wedge pattern strategy involves waiting for breakout confirmation, entering in the breakout direction, and managing risk with stop loss and take profit.
To better master these analytical methods, you should explore the Forex Technical Analysis section to build a solid foundation before applying them in real trading.
Wedge pattern trading breakout mechanics
Wedge pattern trading breakout mechanics focus on the precise moment when price breaches one of the converging trendlines, signaling that the period of market compression has ended and a new directional trend is starting.
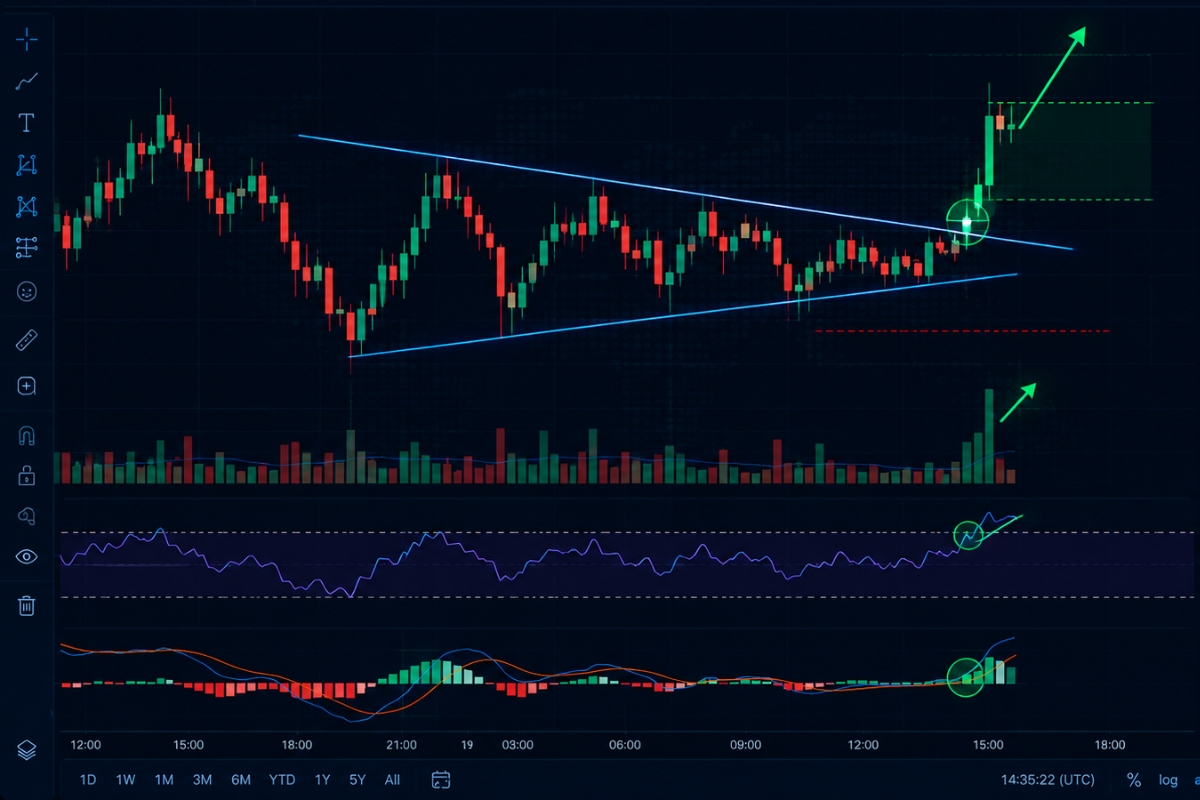
Statistically, a valid breakout occurs within the final 30% to 70% of the wedge’s total structure, well before the price reaches the absolute apex of the converging lines. This sudden surge in price action represents a massive release of accumulated market energy, providing retail traders with high-probability entry points.
How to identify a valid wedge breakout in trading?
A valid wedge breakout is identified by a combination of price closure and matching volume metrics.
- Candle Close: A candlestick must close completely outside the upper or lower boundary trendline on a significant timeframe (such as the 4-Hour or Daily chart).
- Volume Expansion: The breakout candle should ideally coincide with a volume spike that is at least 1.5 to 2 times higher than the average volume observed during the consolidation phase.
- Momentum Confirmation: Indicators like the RSI or MACD should point sharply in the direction of the breakout, confirming systemic backing.
While identifying a valid setup is straightforward, navigating structural failures requires an understanding of what occurs behind the scenes.
What causes false breakouts in wedge pattern trading?
False breakouts, commonly known as “bull or bear traps,” are caused by institutional liquidity sweeps designed to trigger retail stop-loss orders before reversing course. When a market lacks genuine institutional participation, a brief push outside the wedge boundary cannot be sustained, causing the price to quickly snap back into the structure. These traps are highly prevalent in low-liquidity environments or during major macroeconomic news releases when spreads temporarily widen.
Recognizing how breakouts behave allows us to explore how these geometric structures predict structural market turns.
Wedge pattern reversal behavior in financial markets
Wedge pattern reversal behavior represents a fundamental shift in market psychology where the dominant trend completely exhausts its momentum, handing over control to the opposing force.
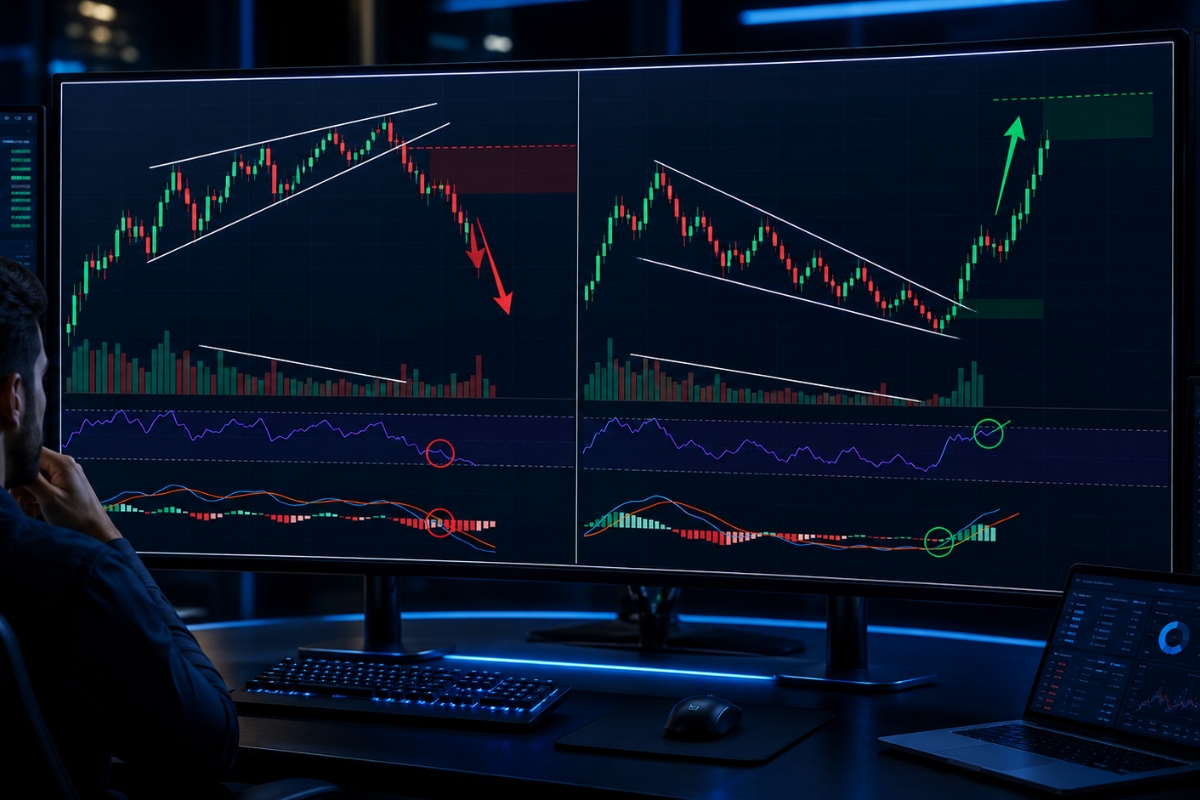
In live financial markets, wedges are categorized as powerful leading indicators of reversals because their converging lines visually display a diminishing rate of price progression. When buyers or sellers fail to maintain the velocity of the primary trend, the asset forms a structural floor or ceiling that sets up a massive macro counter-trend.
Is a rising wedge pattern bullish or bearish?
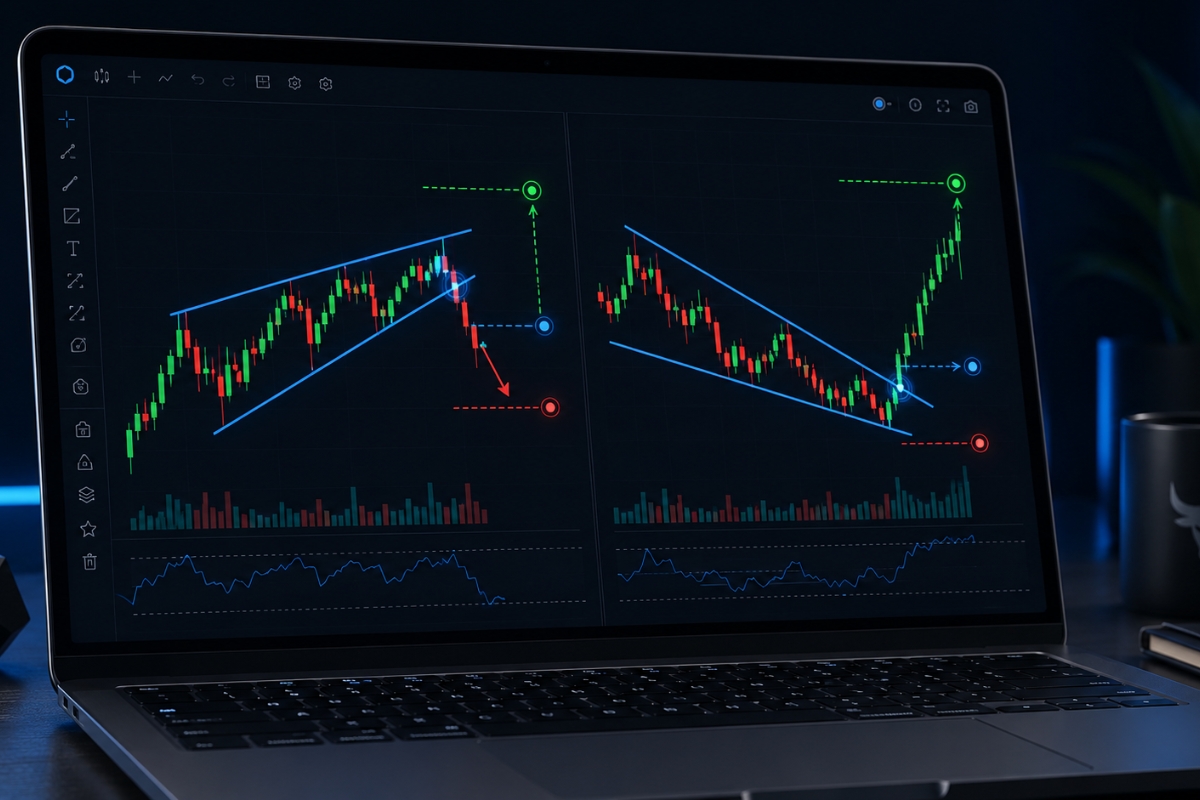
A rising wedge pattern is fundamentally a bearish formation, regardless of whether it develops within a broader uptrend or a prolonged downtrend. It is characterized by two upward-sloping trendlines where the support line rises at a steeper angle than the resistance line, signaling that buyers are losing their aggressive drive. As the price action gets squeezed into a tighter space, buying volume dries up, culminating in a bearish breakdown that reverses the previous upward drift.
Flipping this structural dynamic completely alters the sentiment, transforming a bearish setup into a powerful bullish springboard.
How does a falling wedge signal bullish reversal?
A falling wedge signals a bullish reversal by mapping out a gradual contraction in selling pressure over an extended period.
- Sellers Lose Control: The upper resistance line slopes downward at a steeper angle than the lower support line, indicating that bears are failing to create deeper lower lows.
- Volume Pattern: Trading volume steadily declines as wedge contracts, showing a lack of aggressive short-selling conviction.
- The Bullish Trigger: Once the price breaks above the downward-sloping resistance line, a wave of short-covering and new buying drives an aggressive bullish rally.
Once you comprehend the underlying reversal behavior, the next operational milestone is identifying the precise technical triggers required to enter a trade.
Trading signals and confirmation wedge pattern
Wedge pattern trading signals are actionable technical triggers that notify an analyst when a market structure is ripe for execution. While the raw pattern layout is easy to spot on a chart, professional trade execution relies on a multi-layered confirmation system that filters out random market noise. Relying purely on visual geometry without secondary confirmation variables is a recipe for inconsistent results, making verified signaling filters mandatory for sustainable trading.
Let’s look at the specific indicators that confirm these patterns and how their reliability shifts across different financial asset classes.
What signals confirm a wedge pattern trade?
To confirm a wedge pattern trade with a high degree of mathematical confidence, look for the following secondary technical markers:
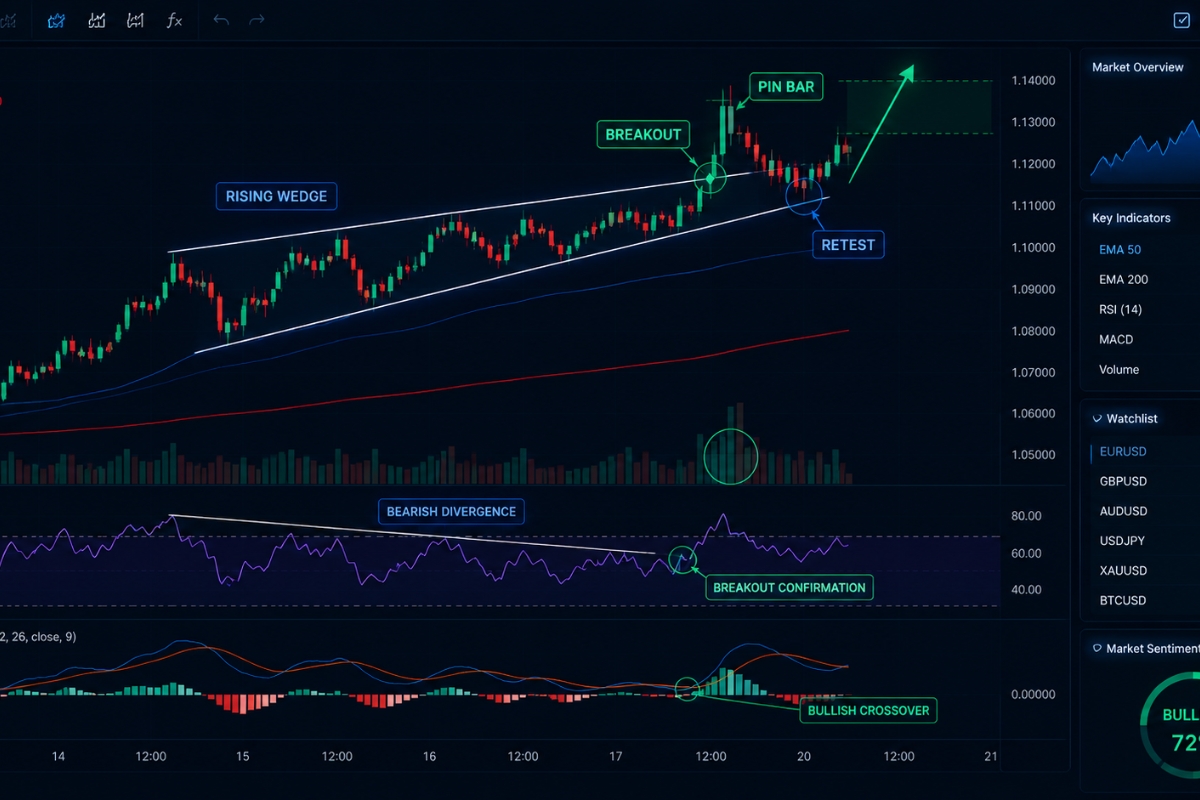
- The Retest Pattern: Price breaks out, returns to touch the broken trendline (converting resistance to support or vice versa), and rejects that level with a strong pin bar candle.
- Moving Average Confluence: The breakout aligns with a cross or a bounce off major moving averages like the 50 EMA or 200 EMA.
- Oscillator Divergence: A sharp bullish or bearish divergence on the RSI at the final peaks/troughs of the wedge highlights a severe momentum mismatch.
Understanding these generic confirmation markers is crucial, but their historical accuracy varies depending on the specific market environment you are trading in.
How reliable are wedge pattern signals in stocks and crypto?
Wedge pattern reliability changes based on market capitalization, liquidity distribution, and structural regulation.
- In Traditional Stocks: Wedge signals are highly reliable on Daily charts because equity markets follow clear corporate earnings cycles and institutional accumulation trends, which drastically reduces artificial price spikes.
- In Cryptocurrency Markets: Wedges are highly effective but suffer from higher frequency “false breaks” due to unregulated liquidations and high retail leverage. Traders at XM Broker are advised to wait for a full 4-Hour or Daily candle close when trading crypto wedges to filter out these erratic liquidity sweeps.
Even with excellent confirmation filters, trading remains a game of probabilities, which requires a deep understanding of risk management.
Risk factors in wedge pattern trading
Risk factors in wedge pattern trading revolve around the inherent volatility of breakout zones, where sudden capital reallocations can easily trigger standard retail stop-loss levels. Even the most textbook wedge structure can fail due to sudden systemic liquidity changes or unexpected macroeconomic policy shifts.
Managing these risks requires an active understanding of where a pattern’s structural invalidation zone lies and how to size your positions to survive a string of consecutive losses.
What are the main risks when trading wedge patterns?
The primary risks associated with trading these geometric configurations include:
- Slippage on Breakouts: During intense market breakouts, your order may be filled at a significantly worse price than expected, throwing off your risk-reward ratio.
- Extended Consolidation: Wedges can sometimes transform into rectangles or broader channels, locking up your trading margin in a stagnant market for weeks.
- Apex Whiplash: Trading too close to the absolute apex of a wedge often results in violent, multi-directional whipsaw movements that trigger stop losses on both sides.
Acknowledging these vulnerabilities allows us to implement defensive protocols to protect our hard-earned equity.
How to reduce risk in wedge pattern trading?
To drastically reduce your risk profile when trading these structures, enforce three strict operational rules:
- Conservative Position Sizing: Never risk more than 1% to 2% of your total account balance on any individual wedge setup.
- Utilize a Retest Entry: Instead of buying the initial breakout, wait for the price to successfully retest the broken trendline, which reduces your required stop-loss size.
- Consult Institutional Platforms: Utilizing broker verification systems and advanced order routing tools recommended by MBroker ensures minimal slippage and superior execution speeds during volatile breakouts.
With a defensive shield firmly in place, you can confidently deploy a fully optimized, step-by-step trading system.
Wedge pattern trading strategy and practical application
A comprehensive wedge pattern trading strategy provides a rule-based framework that eliminates emotional decision-making from the execution process. This strategy relies on identifying structural imbalances, executing only upon verified breakouts, and applying strict mathematical formulas to define your entry, exit, and invalidation levels.
By treating chart geometry as a structured business model, you can extract consistent profits from the markets regardless of market direction.
What is a step-by-step wedge pattern trading strategy?
Follow this detailed 5-step mechanical roadmap and master its application across major asset classes.
- Step 1: Identify wedge structure: Locate a market trend showing a series of higher highs and higher lows (rising wedge) or lower highs and lower lows (falling wedge) where the trendlines are clearly converging.
- Step 2: Wait for breakout confirmation: Patience is paramount. Do not execute a trade until a candlestick closes completely outside the wedge boundary with an expansion in volume.
- Step 3: Enter trade in breakout direction: Open a position immediately upon the close of the breakout candle, or place a limit order at the broken trendline to capture a potential retest move.
- Step 4: Set stop loss outside wedge: For a bearish breakdown from a rising wedge, position your Stop Loss just above the final swing high of the pattern. For a falling wedge, place it right below the final swing low.
- Step 5: Set take profit based on pattern size: Measure the widest part of the wedge structure (the base). Project this exact vertical distance outward from your breakout entry point to establish your realistic, data-driven Take Profit target.
While the core mechanical sequence remains identical, the practical application shifts slightly depending on whether you are analyzing corporate equities or decentralized currency pairs.
How to apply wedge pattern in stocks and forex trading?
When applying this strategy to Stocks, look for wedges that form after a major corporate earnings announcement, as these often mark the start of multi-month institutional trends. In Forex Trading, wedges are highly prominent during the London and New York session overlaps when global liquidity peaks.
Because currency markets are highly mean-reverting, combining wedge structures with the macro data and professional market feeds found on the XM Guide homepage helps you ensure that your trade aligns with the underlying global monetary flows.
In summary, Wedge Pattern structures are exceptional technical tools that provide clear, visual maps of market exhaustion and impending breakout momentum. To continually refine your technical setups and access professional platform tools, make sure to visit the MBroker homepage for the latest expert insights.

Thoren Vextal is a specialist in XM trading guides, offering practical insights and real-market experience to help traders improve their strategies and trading performance. Email: [email protected]