
 Tiếng Việt
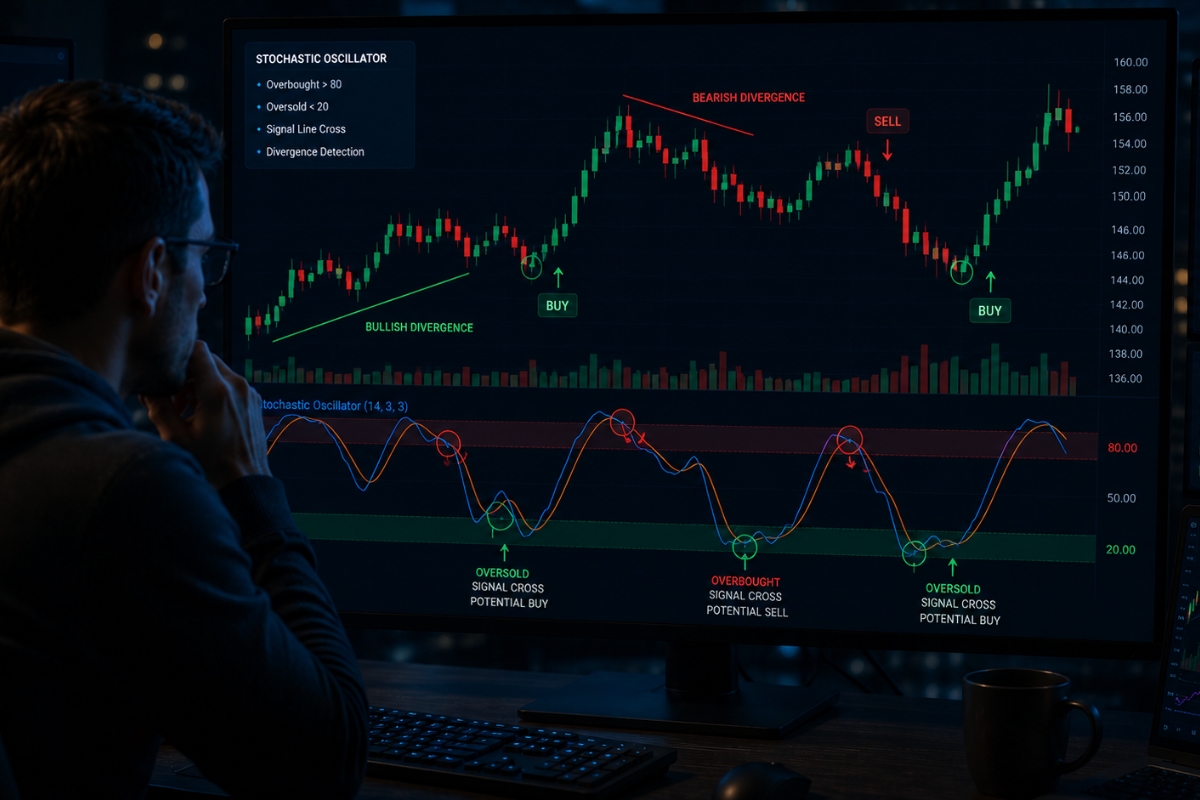
Stochastic Oscillator provides overbought (above 80) and oversold (below 20) signals, helping traders identify potential reversal zones and entry opportunities on the chart.
Additionally, the most common stochastic settings are 14,3,3, which balance sensitivity and accuracy, while traders can adjust parameters based on forex or crypto volatility.
Moreover, stochastic divergence occurs when price moves opposite to the indicator, signaling potential trend reversal and providing early warning for market turning points.
Therefore, an effective stochastic strategy combines trend direction, overbought/oversold levels, and crossover confirmation, allowing traders to enter trades with higher probability setups.
Stochastic oscillator can give false signals in strong trends, so traders must manage risk with stop loss and combine it with other indicators for better accuracy.
The Stochastic Oscillator is one of the most popular indicators used to identify entry points based on price momentum. In the XM Guide section, you will find detailed instructions on how to optimize this indicator in trading.
Stochastic oscillator indicator and signal interpretation
The Stochastic Oscillator indicator functions as a momentum-based boundary gauge that tracks market velocity to determine when an asset is ripe for a directional shift. It operates within a fixed mathematical scale ranging from 0 to 100, where readings above 80 mark indicate overbought territory and values below 20 indicate oversold conditions.
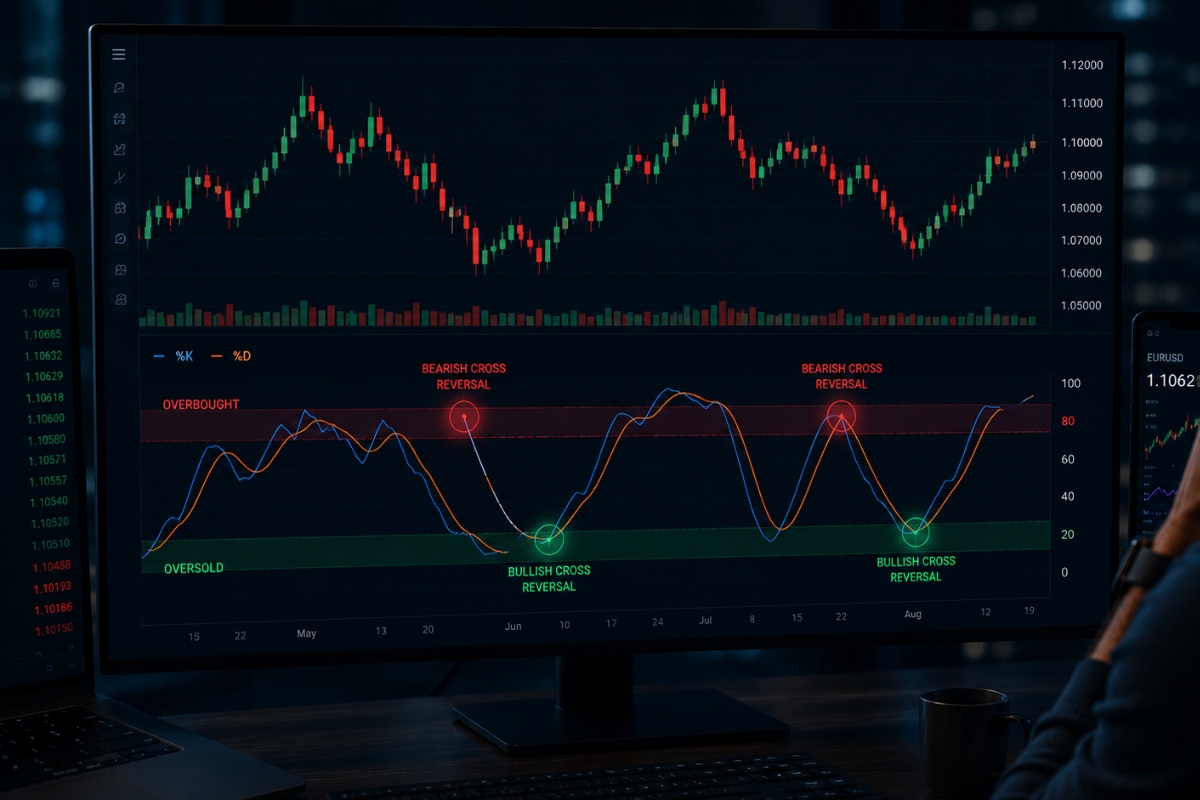
Because momentum always precedes price, mastering the interpretation of its two key lines—% K (the fast line) and % D (the slow-moving average line)—allows traders to forecast trend reversals with high accuracy.
What signals does the stochastic oscillator provide?
The Stochastic Oscillator generates three foundational technical signals that assist in active market navigation:
- Overbought/Oversold Signals: When the lines cross above 80 or drop below 20, it alerts traders to potential market extremes where the current trend may be running out of steam.
- Crossover Signals: A bullish signal occurs when the faster %K line crosses above the slower %D line from below the 20 threshold, while a bearish signal occurs when %K breaks below %D from above 80.
- Structural Convergence: It highlights whether current buying or selling velocity is accelerating or decelerating relative to historical volatility.
While understanding these core signals is simple, reading them accurately in a real-time layout requires a systematic look at chart structure.
How to read stochastic oscillator on a chart?
Reading the oscillator requires a simultaneous look at the price candles and the corresponding indicators below the chart.
- Identify Boundaries: Look at the horizontal reference bands usually set at 80 and 20.
- Track the %K and %D Lines: Watch for areas where the two lines twist or cross each other within these extreme zones.
- Execute the Timing: The highest-probability reversal signal occurs not when the lines first enter the extreme zones, but when they turn around and break back inside the 20–80 boundary area.
Once you can read basic signals smoothly, the next step toward professional trading is adjusting the underlying inputs to remove market noise.
Settings and optimization stochastic oscillator
Stochastic oscillator settings must be optimized to match your specific asset class and trading style to prevent false signals while keeping entry latency low.
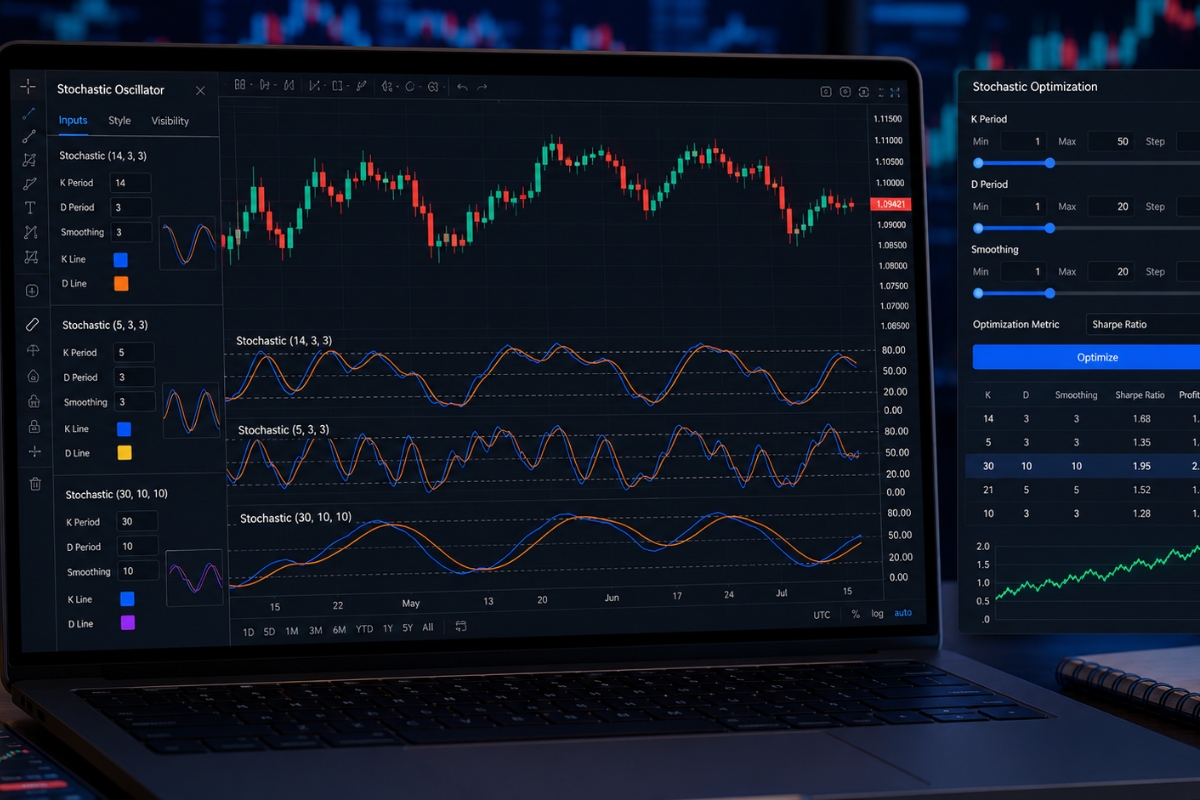
The traditional default configuration for this tool is (14, 3, 3), where 14 represents the lookback period, the first 3 signifies %K smoothing, and the second 3 represents %D smoothing. While these default metrics are a solid starting point for general market analysis, day traders and institutional funds routinely tweak these variables to extract maximum accuracy.
What are the best stochastic oscillator settings?
The definition of the “best” setting depends entirely on your specific holding period and strategy constraints:
- Standard Default (14, 3, 3): This is the most balanced setting, offering an excellent compromise between speed and reliability across daily and 4-hour charts.
- Short-Term Scalping (5, 3, 3): A hyper-sensitive setting that responds instantly to minor price movements, though it produces a higher frequency of false breakouts.
- Long-Term Swing Trading (21, 7, 7) or (30, 10, 10): A deeply smoothed baseline that completely removes short-term market noise, leaving only major structural turns visible.
Choosing a baseline profile is only the first step, as you must adapt these parameters when moving from traditional currency pairs to modern digital assets.
How to adjust settings for forex and crypto trading?
Adjusting settings requires an understanding of the underlying asset’s structural volatility profile.
- In Forex Trading: Currency markets are heavily mean-reverting and trade inside liquid macro ranges. Utilizing a standard (14, 3, 3) setup works perfectly on major pairs like EUR/USD, allowing traders at MBroker to catch precise intraday swing highs and lows.
- In Cryptocurrency Trading: Crypto assets feature high volatility and prolonged, aggressive trends. To prevent getting stopped out by false oversold readings during a major Bitcoin bull run, traders should increase the lookback period to (20, 5, 5) or (30, 10, 10) to heavily smooth the indicator line.
With your settings fine-tuned, you are now equipped to look for the most powerful configuration the indicator can form: structural divergence.
Stochastic oscillator divergence in trading analysis
Stochastic oscillator divergence is an advanced analytical concept that occurs when price action moves in the opposite direction of the momentum line, revealing a hidden trend weakness.
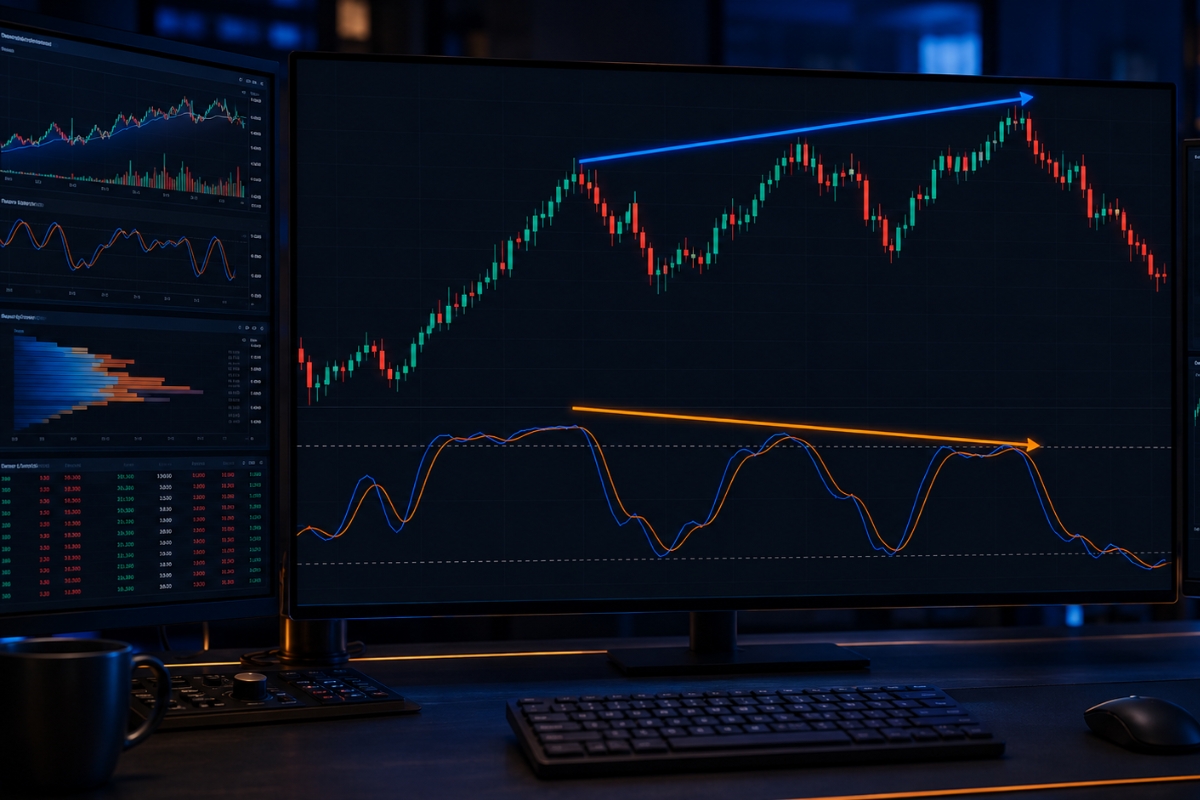
It is one of the most reliable leading signals available in technical analysis because it mathematically proves that while price is making a new extreme, the internal volume velocity is slowing down. Recognizing this structural mismatch allows professional traders to position themselves at the exact inception point of an impending trend collapse.
What is stochastic oscillator divergence?
Stochastic oscillator divergence is a split between price trajectory and momentum progression, categorized into two main types:
- Regular Bearish Divergence: The price makes a clear higher high, but the Stochastic lines form a distinct lower high. This indicates that the bullish trend is running on empty.
- Regular Bullish Divergence: The price prints a lower low, but the Stochastic lines show a definitive higher low. This proves that selling pressure is completely exhausted despite the lower nominal prices.
Recognizing a divergence on a static chart is simple, but trading it in a live environment requires a strict execution layer to manage risk.
How to trade divergence effectively?
Trading a divergence effectively requires waiting for the market to validate the signal before risking any capital.
- Confirm the Level: Ensure the divergence is taking place in a major historical support or resistance zone.
- Wait for the Crossover: Do not trade on the divergence alone; wait for the %K line to cross over the %D line as additional structural confirmation.
- Execution Filter: Entering positions based on higher-timeframe divergences (such as 4-Hour or Daily charts), a practice widely supported by educational specialists at MBroker, dramatically improves your historical win rate.
Now that you have mastered signals, settings, and divergence filters, we can combine these elements into a systematic trading strategy.
Trading strategy and application stochastic oscillator
A comprehensive stochastic oscillator trading strategy converts individual indicator inputs into a rule-based execution matrix that eliminates emotional guesswork. This strategy relies on identifying structural trends, waiting for key exhaustion signals, verifying entries via line crossovers, and applying strict mathematical exits to protect your capital. By treating technical setups as an objective checklist, you can build a scalable and repeatable business model in the markets.
What is a step-by-step stochastic trading strategy?
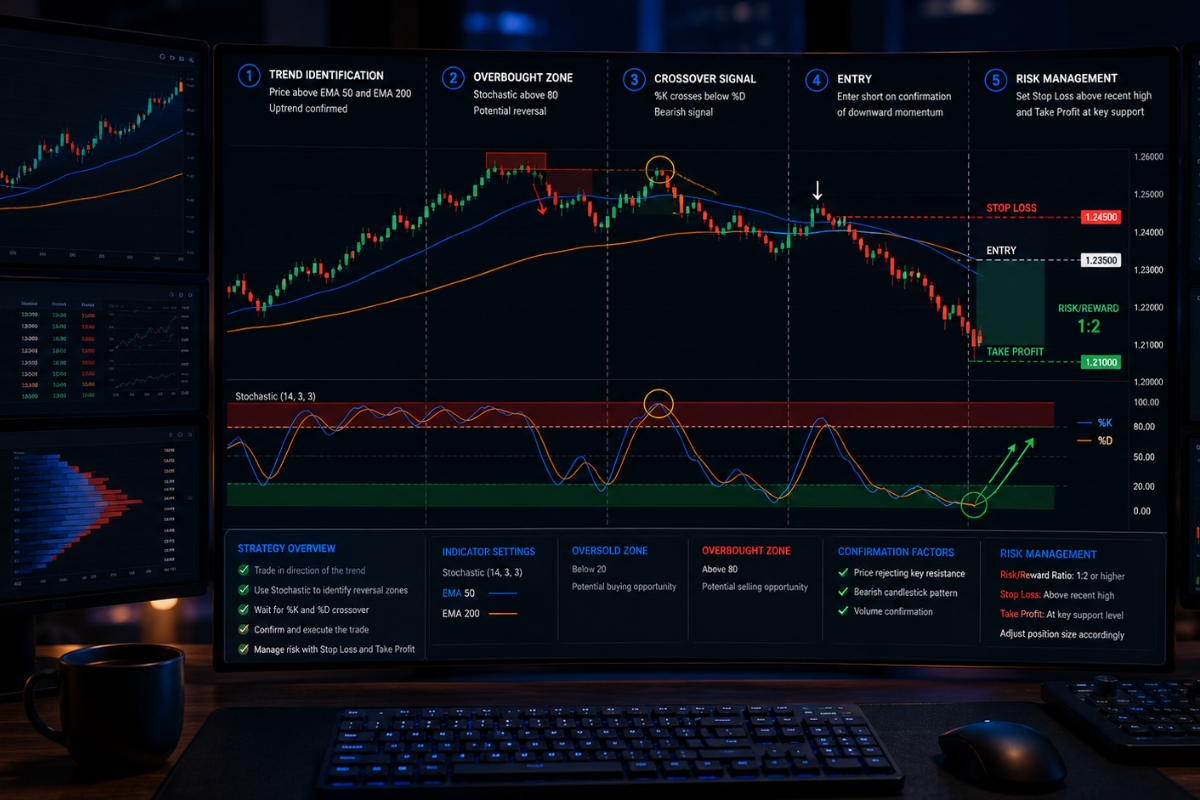
This detailed, 5-step blueprint to execute a professional momentum strategy, followed by advanced indicator pairing methods.
- Step 1: Identify trend direction: Always trade in the direction of the dominant macro trend. Use a higher-timeframe filter (like the 200-period Exponential Moving Average) to confirm whether you should only be looking to buy setups or sell setups.
- Step 2: Wait for overbought/oversold condition: If the macro trend is bullish, wait patiently for the Stochastic lines to drop below the 20 line into the oversold zone. If the trend is bearish, wait for them to climb above 80.
- Step 3: Confirm with crossover or divergence: Monitor the oversold or overbought zone closely. Wait for the %K line to cross above the %D line, or look for a clear bullish/bearish divergence to appear.
- Step 4: Enter trade: Execute your entry market order immediately upon the close of the candlestick that completes the valid Stochastic line crossover.
- Step 5: Set stop loss and take profit: Place your Stop Loss a few pips below the recent local swing low (for longs) or above the recent swing high (for shorts). Set your Take Profit at a level that guarantees at least a 1:2 Risk-to-Reward ratio.
While price action and stochastics are highly powerful on their own, pairing this strategy with complementary tools unlocks a higher tier of performance.
How to combine stochastic with other indicators?
Because the Stochastic Oscillator is a pure momentum tool, it should always be paired with trend or volume indicators to filter out false signals during strong trending markets:
- Stochastic + Moving Averages (EMA): Only take bullish Stochastic crosses when the price is trading above the 50 and 200 EMA.
- Stochastic + Average Directional Index (ADX): Use the ADX to measure trend strength. If ADX is below 25 (ranging market), trade the overbought/oversold extremes; if ADX is above 25 (strong trend), only trade Stochastic signals that align with the trend direction.
- Unified Platform Execution: Accessing advanced charting suites and real-time liquidity feeds via the MBroker homepage allows you to combine these multi-indicator setups smoothly without platform lag.
Every professional strategy must account for its own vulnerabilities, which leads us to the final component: risk management and structural limitations.
Risk and limitations of stochastic oscillator in trading
Understanding the risk and structural limitations of the stochastic oscillator is mandatory if you want to avoid catastrophic drawdown during explosive market conditions. The indicator is a derivative of price, meaning it tracks historical data and can remain locked in extreme overbought or oversold conditions for extended periods during a strong, institutional-driven trend. Recognizing these weak spots allows you to implement defense protocols to preserve your trading equity when a setup goes wrong.
Let’s analyze the primary vulnerabilities of this indicator family and how to manage your risk exposure over time systematically.
What are the limitations of stochastic oscillator?
The core limitations that every trader must be aware of include:
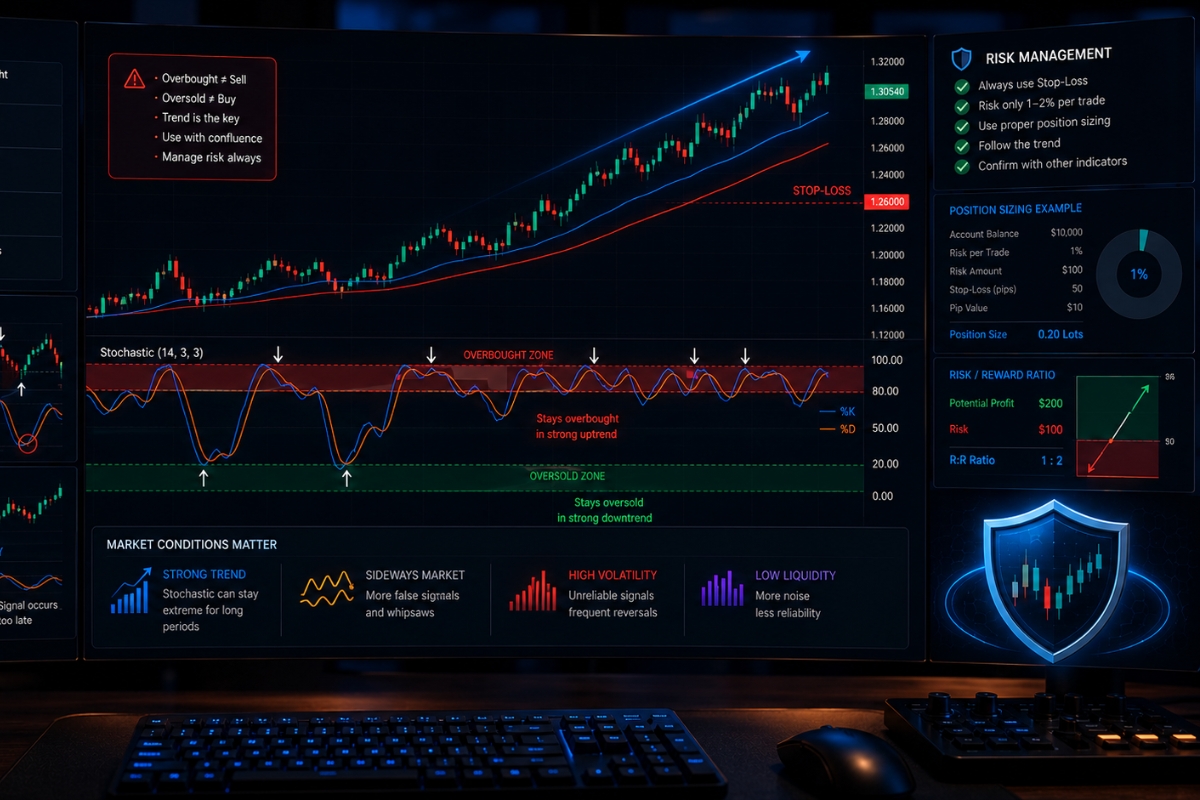
- The “Trending Market” Trap: During a massive, news-driven trend, the oscillator will hit overbought or oversold levels very quickly and stay there while the price continues to move aggressively against you.
- Whipsaw in Consolidations: In highly choppy, low-liquidity markets, the lines will cross each other repeatedly, generating numerous false signals.
- Lag Factor: Because it relies on historical lookback periods, the crossover signal can occasionally occur after a significant portion of the price move has already taken place.
Acknowledging these technical limitations allows you to transition from standard chart analysis to professional asset protection.
How to manage risk when using stochastic oscillator?
To permanently eliminate the threat of account liquidation when using this tool, enforce three strict risk boundaries:
- Never Trade Without a Stop Loss: Always have a hard stop-loss order resting on the broker server to protect against sudden market drops.
- Conservative Position Sizing: Limit your maximum risk to 1% or 2% of your total account balance on any individual indicator setup.
- Context Verification: Never trade a Stochastic signal in isolation; always verify that your entry matches the broader macroeconomic data and platform standards provided by Forex Technical Analysis to ensure you are trading with an institutional edge.
The Stochastic Oscillator remains an incredibly powerful and flexible weapon in a trader’s arsenal when deployed with proper settings, structural divergence filters, and strict risk parameters. By waiting for verified boundary crossovers and trading in alignment with the dominant macro trend, you can convert market momentum into a consistent trading advantage.

Thoren Vextal is a specialist in XM trading guides, offering practical insights and real-market experience to help traders improve their strategies and trading performance. Email: [email protected]