
 Tiếng Việt
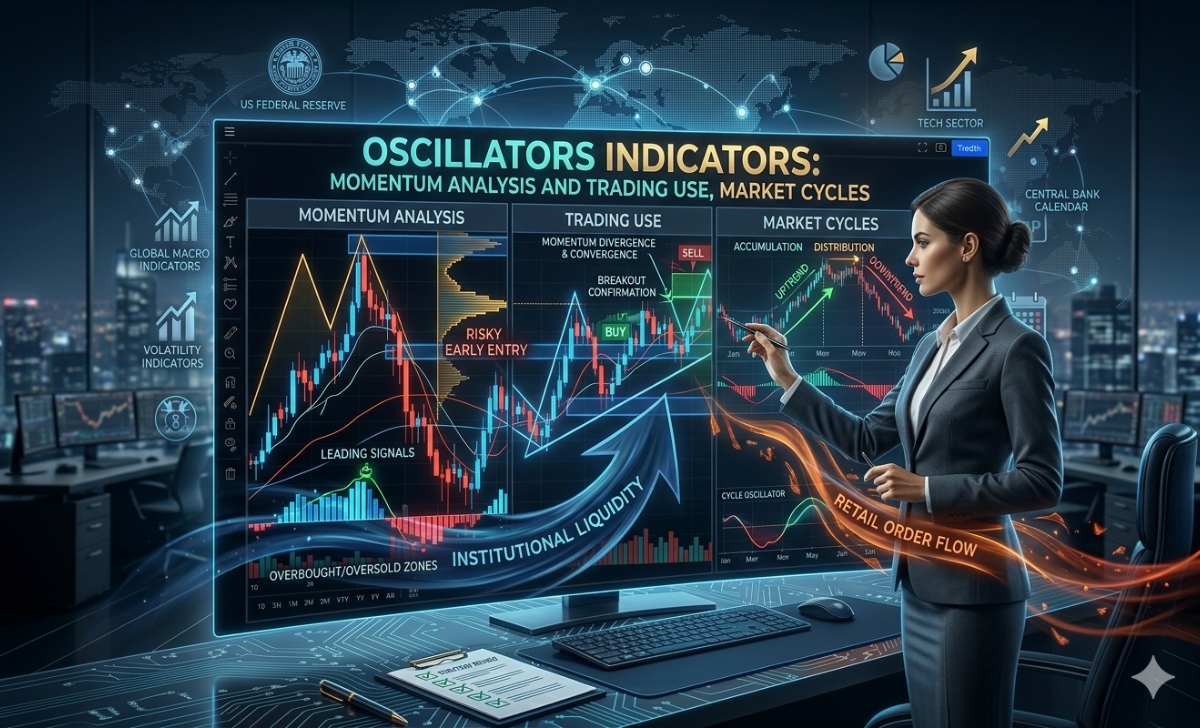
Oscillators indicators are technical tools used to identify overbought and oversold conditions, helping traders anticipate potential price reversals in ranging markets with high accuracy.
Moreover, oscillators are widely used for momentum analysis by measuring the speed and strength of price movements, allowing traders to detect weakening trends and possible turning points.
Additionally, oscillators indicators are applied in trading to generate entry and exit signals, especially through divergence, overbought/oversold zones, and crossovers in forex markets.
Furthermore, oscillators reflect market cycles by moving between fixed ranges (typically 0–100), helping traders understand accumulation, expansion, and exhaustion phases.
Understanding oscillators indicators is key to mastering momentum analysis and timing the market effectively. At XM Guide, traders gain practical insights to apply these tools in real trading strategies.
Oscillators indicators definition?
Oscillators indicators are a specialized class of technical analysis tools designed to measure the velocity and magnitude of price movements by bounding mathematical calculations within fixed upper and lower extreme parameters, typically ranging from 0 to 100.

These tools map out short-term market momentum, moving dynamically between overbought and oversold thresholds to signal when a price trend has extended too far from its statistical mean. Incorporating these bounded metrics into your technical framework allows you to pinpoint local market turning points and anticipate clean price reversals before standard chart patterns fully materialize.
What are oscillators indicators in trading?
In active financial trading, oscillators indicators serve as mathematical price scales that measure the immediate acceleration of buying or selling pressure. Unlike open-ended chart tools, an oscillator relies on rolling historical price formulas (such as comparing closing prices over a default 14-period window) to plot a smooth visual line that waves back and forth across a central equilibrium line. This design helps day traders identify structural market extremes, confirming whether an asset is experiencing extreme buying greed or deep selling panic.
Recognizing this internal calculation logic clarifies why these bounded studies behave entirely differently than classical trend overlays.
Why are oscillators different from trend indicators?
Oscillators and trend indicators serve two fundamentally different analytical purposes in market tracking:
- Oscillators Indicators: Are leading or real-time indicators engineered to identify momentum velocity and structural exhaustion inside bound ranges (e.g., RSI, Stochastic). They excel in sideways, consolidating, or range-bound market environments.
- Trend-Following Indicators: Are lagging indicators designed to capture long-term directional paths and structural macro shifts across open-ended space (e.g., Moving Averages, Ichimoku Clouds). They perform best in strong, runaway trending markets but suffer severe whipsaws during periods of horizontal consolidation.
Once you understand these structural differences, you can begin leveraging oscillators to extract precise momentum insights from raw price charts.
Momentum analysis using oscillators indicators
Momentum analysis using oscillators indicators is the technical discipline of evaluating the rate of change in price velocity to determine if the dominant market force is expanding or contracting.

Mathematically, price movement always follows momentum; a sharp price rally that is not backed by an expansion in oscillator velocity indicates an unstable move that is highly susceptible to a sudden market collapse. Utilizing these bounded oscillators allows professional day traders to look beneath the surface of a price candle, exposing the true institutional volume velocity that is actively steering the order book.
How do oscillators measure market momentum?
Oscillators calculate market momentum by continuously measuring the mathematical distance between current closing prices and their historical price ranges over a set number of candles. For instance, if an asset closes consistently near the absolute high of its recent 14-day boundary, the oscillator’s internal formula triggers a sharp upward surge toward its maximum threshold. This real-time tracking provides a clean visualization of price acceleration, allowing you to see exactly how fast institutional capital is flowing into or out of a specific financial instrument.
As these mathematical lines interact with their upper and lower boundaries, they trigger highly specific structural trading signals.
What are some common momentum signals from oscillators?
The primary technical signals generated during active momentum analysis can be classified into three distinct execution categories:
- Overbought Conditions: Occur when the oscillator crosses above its upper boundary (typically the 70 or 80 line), signaling that buying velocity has peaked and the asset is vulnerable to a pullback.
- Oversold Conditions: Manifest when the indicator drops below its lower boundary (the 30 or 20 line), indicating that short-term selling pressure is completely exhausted.
- Momentum Divergence: A powerful structural mismatch where price prints a higher swing high but the oscillator prints a lower swing high, revealing a hidden loss of institutional velocity that often triggers an aggressive trend reversal.
Transforming these abstract momentum readings into sustainable profits requires applying these signals directly within liquid, real-world execution environments.
Trading use of oscillators indicators in real markets
The trading use of oscillators indicators in real markets focuses on capitalizing on short-term price pullbacks and timing high-probability entries at major structural support and resistance boundaries.

Statistically, day traders utilize these tools to filter out market noise, ensuring they only buy when transaction velocity is heavily compressed and ready to spring backward toward value equilibrium. When you integrate these systematic momentum filters into your active workspace, you significantly reduce the risk of chasing overextended trends and dramatically improve your overall execution accuracy.
How to use oscillators indicators in forex trading?
To accurately apply oscillators within a live forex execution environment, follow this definitive 4-step professional roadmap:
- Step 2: Track the Structural Pullback: Wait for a short-term correction to occur, forcing the oscillator line deep into its extreme oversold zone (below 30) on your execution chart.
- Step 3: Confirm the Momentum Crossover: Monitor the indicator window; wait for the fast oscillator line to cross cleanly back above the oversold line, confirming that buying velocity has officially resumed.
- Step 4: Execute Your Order Position: Place your long entry order immediately, securing a protective stop-loss directly below the recent local swing low to preserve your trading capital.
To run this step-by-step system successfully, you must select the correct momentum tool for your specific strategy profile.
Which oscillators indicators are most commonly used?
The global financial markets rely heavily on three core, time-tested oscillator variations:
- Relative Strength Index (RSI): A single line oscillator that tracks internal price strength on a scale of 0 to 100, widely considered the gold standard for identifying structural divergence patterns.
- Stochastic Oscillator: A high-velocity two-line tool ($$\%$$ and $$\%$$) that tracks close-to-range placement, making it exceptionally effective for timing short-term scalping reversals in range-bound markets.
- Commodity Channel Index (CCI): An oscillator that measures an asset’s current price relative to its average price over a set period, ideal for identifying new cyclical trends and extreme institutional anomalies.
To elevate these tools beyond basic range tools, you must learn to analyze them through the lens of macro market cycles.
Market cycles and the role of oscillators indicators
Market cycles dictate that financial assets constantly transition through four distinct phases: Accumulation, Markup (Trending), Distribution, and Markdown, with oscillators indicators serving as the primary technical mechanism to identify these structural shifts.

Market spends roughly 70% of its historical timeline consolidating within horizontal ranges or cycling between local waves, creating an ideal environment for bounded indicators to excel. By evaluating your oscillator data through a macro cyclical framework, you can easily determine whether a market is building energy for an explosive breakout or simply rotating between established boundaries.
How do oscillators reflect market cycles?
Oscillators reflect market cycles by mapping the internal accumulation and distribution behavior of institutional capital across different timeframes. During an accumulation cycle, the oscillator will consistently bounce off its lower oversold floor, revealing that large institutional buyers are absorbing sell orders at a specific support zone. Conversely, during a distribution cycle, the indicator will lock tightly near its upper overbought ceiling, showing that smart money is systematically liquidating its positions to unprepared retail buyers before a markdown cycle begins.
Recognizing which phase of the cycle is currently active allows you to adjust your execution strategy for maximum efficiency.
When are oscillators most effective in market cycles?
Oscillators indicators reach their absolute highest mathematical accuracy during the Accumulation and Distribution (Ranging) phases of a market cycle. In these horizontal, non-trending environments, prices move predictably between clear support and resistance coordinates, allowing oscillators to accurately signal local tops and bottoms with minimal lag. To maximize your execution precision during these cyclical rotations, ensure you monitor the real-time market updates and professional macro reports published regularly on the MBroker.
While these tools are incredibly powerful during range rotations, they carry structural flaws that can severely damage your portfolio if applied incorrectly during trend phases.
Limitations and best practices when using oscillators indicators
The limitations of oscillators indicators stem from their tendency to generate devastating false signals (“indicator pinning”) when a market breaks out into an aggressive, runaway institutional trend phase.

During a massive trend expansion, an oscillator can lock inside an overbought or oversold extreme for weeks at a time, repeatedly triggering premature counter-trend sell signals that can easily destroy a retail account. Managing this structural flaw requires implementing an ironclad combination of multi-timeframe filters, volume confirmations, and strict stop-loss rules.
What are the limitations of oscillators indicators?
The primary limitation of any bounded oscillator is its lack of directional trend context, which leads to structural execution traps:
- The Overbought Trap: In a strong bullish trend, an oscillator will enter the overbought zone almost immediately; traders who sell blindly will get crushed as the trend continues surging upward.
- Lagging Extreme Calculation: Because oscillators rely on past moving averages, their signals can lag behind real-time black-swan events, resulting in delayed stop-out executions.
- False Range Breaks: In low-liquidity environments, oscillators can trigger erratic crossovers that reflect random price noise rather than a genuine shift in institutional momentum.
To neutralize these built-in limitations, you must combine your oscillator metrics with a structured, multi-layered risk management framework.
How to use oscillators indicators effectively in trading?
To maximize the accuracy of your oscillators and maintain complete control over your portfolio risk, enforce these four strict institutional best practices:
- Enforce a Higher-Timeframe Trend Filter: Only take bullish oscillator signals if the asset is trading cleanly above its 200-period Simple Moving Average (SMA) on the daily chart.
- Combine Momentum with Structural Volume: Always verify that an oscillator breakout or divergence signal is accompanied by an expansion in vertical volume to ensure genuine bank participation.
- Execute via Limit Orders Only: Never chase a delayed signal with market orders; deploy precise limit entries to protect your account from execution slippage.
- Leverage Verified Institutional Infrastructure: Reviewing the pristine charting data, account configurations, and advanced platform tutorials highlighted on the MBroker ensures your trading station is optimized to execute momentum strategies flawlessly under any market condition.
In short, Oscillators Indicators are indispensable tools for measuring momentum velocity, identifying structural exhaustions, and timing high-probability entries within broader market cycles. By filtering extreme range signals through a macro trend overlay, utilizing tools like the RSI or Stochastic, and strictly avoiding counter-trend setups during runaway trend expansions, you can eliminate execution guesswork.

Thoren Vextal is a specialist in XM trading guides, offering practical insights and real-market experience to help traders improve their strategies and trading performance. Email: [email protected]