
 Tiếng Việt
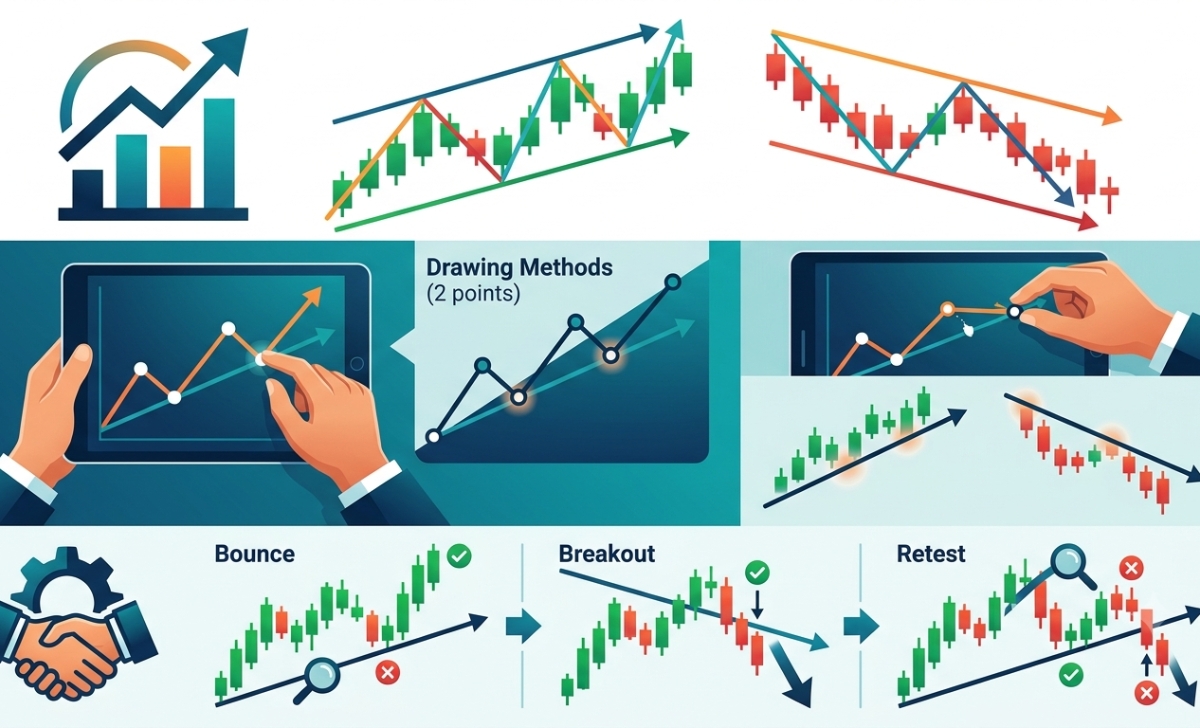
Trendlines trading is a method of identifying market direction using price structure to determine entry and exit points, helping traders follow trends and avoid counter-trend risks.
Furthermore, trendline structure reflects market behavior by connecting key highs or lows to define uptrends and downtrends, allowing traders to understand momentum and potential reversals.
Accurate trendline drawing requires at least two significant price points and proper angle alignment, ensuring reliable signals and avoiding false trend interpretations.
Therefore, trendline trading strategies focus on bounce and breakout setups, where traders enter at support/resistance or capitalize on strong trendline breaks.
On XM platform, trendline trading can be executed efficiently using MT4/MT5 tools with real-time data and precise order execution, supporting both manual and strategy-based trading.
Trendlines trading is a core technical method used to identify market direction and key price levels. In this guide, you’ll learn how to draw trendlines correctly, analyze market structure, and apply effective trading strategies on XM with support from XM Guide.
What is trendlines trading and how does it work?
Trendlines trading is a structural technical analysis methodology that utilizes straight lines drawn across specific price pivot points to visualize market direction, identify dynamic support or resistance boundaries, and locate low-risk entry zones.
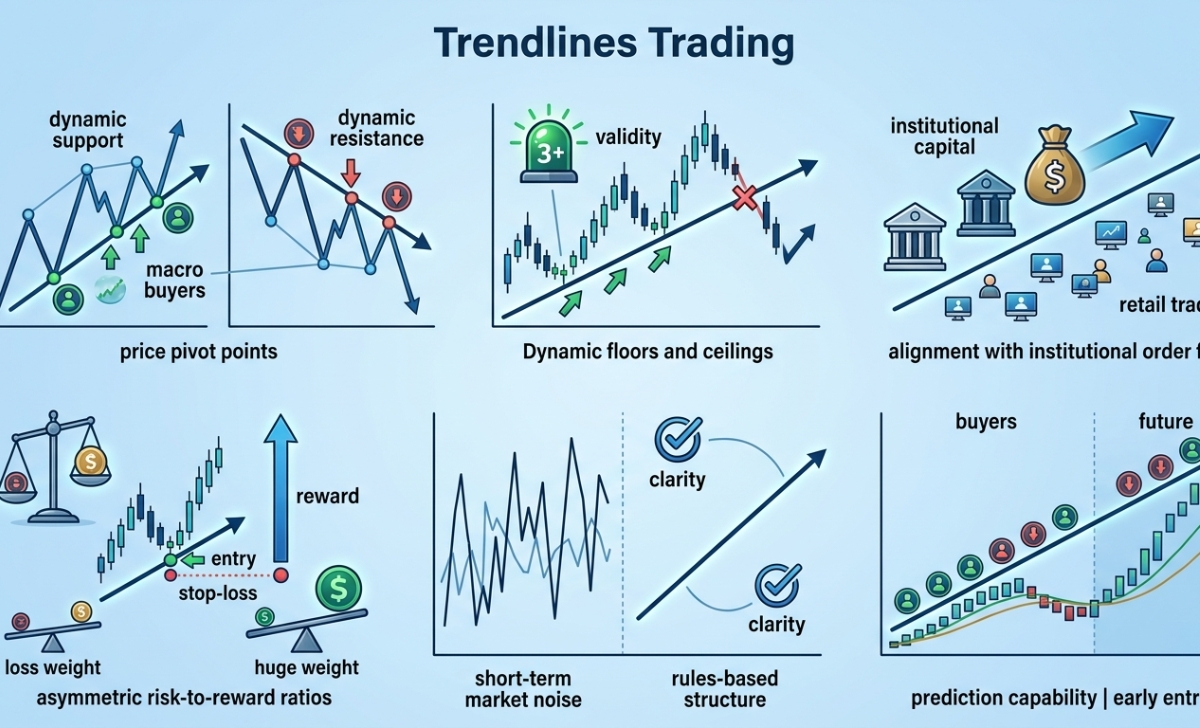
Statistically, a verified trendline requires a minimum of 3 consecutive price touches to be considered valid, serving as a dynamic floor or ceiling that keeps retail traders perfectly aligned with major institutional order flow. By projecting these diagonal boundaries onto your charts, you gain the ability to predict where macro buyers or sellers will re-enter the market well before lagging indicators register the move.
What is a trendline in trading?
A trendline is a fundamental technical analysis tool that visualizes structural diagonal boundaries by connecting a sequence of price highs or price lows on a chart. In an uptrend, the line is drawn beneath the price action by connecting consecutive higher lows, serving as a dynamic support floor. Conversely, in a downtrend, the line is anchored above the price action by connecting consecutive lower highs, acting as a dynamic resistance ceiling that maps out the dominant supply pathway.
Recognizing how these lines isolate the path of least resistance explains their critical role across daily trading desks.
Why are trendlines important in forex trading?
Trendlines are incredibly important in forex trading because they bridge the gap between abstract price fluctuations and objective, rules-based risk management. In a market moving over $7.5 trillion daily, these lines help retail traders track institutional capital positioning without getting distracted by short-term market noise. Furthermore, they provide high-probability entry coordinates where stop-loss orders can be tightly compressed, giving you an effective mechanism to achieve highly asymmetric risk-to-reward ratios on your positions.
Once you appreciate their structural importance, you can begin analyzing how these lines map shifting market behavior.
Trendline structure and market behavior analysis
Trendline structure provides deep market behavior analysis by revealing the exact velocity, stability, and institutional commitment driving a financial asset’s current price cycle.
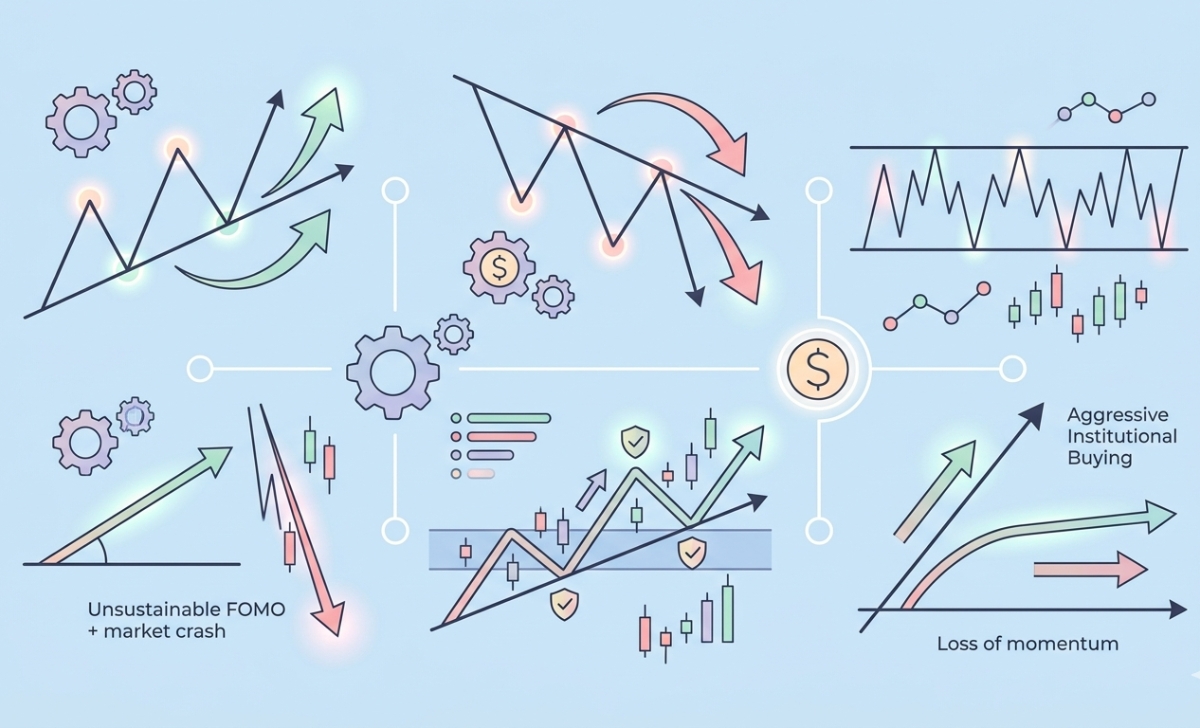
The structural angle of a trendline serves as a direct indicator of trend sustainability; lines sloped between 30° and 45° represent stable, healthy market cycles, whereas steep angles exceeding 60° point to unsustainable retail FOMO that typically precedes a massive market crash. Dissecting these structural parameters allows you to easily separate authentic structural trends from temporary, speculative price spikes.
How to identify trends using trendlines?
To accurately identify market trends using dynamic lines, you must evaluate the direction and consistency of the structural price pivots:
- Bullish Trend Isolation: Confirmed when price action consistently prints clear higher highs and higher lows, and a rising diagonal line can be seamlessly drawn beneath the troughs.
- Bearish Trend Isolation: Confirmed when price action prints consecutive lower highs and lower lows, accompanied by a descending diagonal line anchored across the peaks.
- Sideways Consolidation: Occurs when price moves horizontally, causing diagonal lines to flatten or cross repeatedly, signaling a non-trending phase where trendline models should be benched.
Understanding these broad phases allows you to analyze the underlying supply and demand dynamics shifting within the trend structure.
What does trendline structure reveal about the market?
The physical structure of a trendline reveals the psychological state and urgency of the dominant market participants:
- Steepening Slopes: Indicate that institutional buyers are becoming highly aggressive, entering positions at progressively higher prices without waiting for deep corrective pullbacks.
- Flattening Slopes: Reveal a loss of structural momentum, warning that the dominant side is losing control of the order book and a reversal may be brewing.
- Repeated Validation Taps: Prove that global market makers are actively defending that specific price geometry, turning the line into a heavily protected liquidity zone.
Once you know what these structures reveal, you must learn the exact technical drawing rules required to map them accurately.
Drawing methods for trendlines in trading
The professional drawing methods for trendlines in trading require anchoring your tools across pristine, unmanipulated structural swing points to guarantee that your lines represent real institutional supply and demand zones.

Drawing lines incorrectly across random candle bodies rather than extreme wick tips creates a compounding geometric error that leads to execution lag and false breakout entries. Implementing a disciplined, repeatable drawing methodology across your charts ensures that your visual indicators perfectly match the automated liquidity algorithms running across major interbank networks.
How to draw trendlines correctly for beginners
To draw highly accurate, institutional-grade trendlines on your terminal, follow this definitive 4-step framework:
- Step 1: Identify the Major Trend Direction: Look at your higher-timeframe chart (H4 or Daily) to determine whether the market is overall bullish or bearish to ensure you draw the correct line configuration.
- Step 2: Locate the Primary Anchor Points: Find the absolute lowest point (for an uptrend) or the highest point (for a downtrend) of the price move to serve as your definitive Anchor Point 1.
- Step 3: Connect to the Next Major Swing Pivot: Extend your line forward and adjust it to touch the next major structural higher low or lower high (Anchor Point 2) without cutting through any candle bodies.
- Step 4: Wait for Confirmation: Extend the line outward into blank space; the trendline is officially confirmed and ready to be traded only when the market returns to execute a clean Anchor Point 3 validation tap.
By cementing this visual checklist into your charting routine, you can easily protect your terminal from common user errors.
What are common mistakes when drawing trendlines?
The most destructive mistake a beginner can make is “forcing” a trendline to fit a personal market bias by drawing lines through the middle of thick candlestick bodies. This amateur practice invalidates the geometric integrity of the setup because it ignores real transactional data points (wick extremes) where heavy liquidation occurs. Additionally, attempting to draw lines on lower M1 or M5 timeframes during low-volume periods yields unstable structures that easily break due to random retail noise rather than real institutional trend shifts.
Avoiding these drawing errors prepares you to integrate these lines into a complete trading strategy.
Trading strategy XM using trendlines
An institutional trading strategy XM using trendlines utilizes a dual execution architecture focused on either structural bounce continuations or high-volume breakout setups to capture explosive directional impulses.

Executing positions precisely at a verified trendline intersection drops average transaction costs by compressing your required stop-loss size to tiny structural fractions. Deploying these rule-based entry protocols within a premium brokerage infrastructure ensures that your technical signals are filled instantly without artificial delays or hidden friction fees.
How to trade with trendlines on XM platform?
To trade trendline bounces with absolute precision on the XM platform, use this systematic execution checklist:
- Monitor the Retest: Wait for the price to slowly retrace back to a verified, long-term trendline on your chart.
- Verify Candlestick Confirmation: Look for a bullish rejection candle (like a Pin Bar or Engulfing pattern) to print directly on the line, proving buyers are active.
- Execute the Position: Open your order immediately upon the closing tick of the confirmation candle via your XM terminal.
- Set Risk Parameters: Place your protective stop-loss safely 5–10 pips below the trendline structure and project a profit target at the previous structural swing high.
While trading the bounce keeps you aligned with the current trend, you must also prepare for the exact moment that trend officially collapses.
How does trendline breakout trading work?
Trendline breakout trading works by capitalizing on the extreme liquidity surge that occurs when a dominant dynamic boundary is violently breached by opposing market forces. When a rising trendline is broken by a strong bearish candle close, it triggers an absolute mathematical avalanche: thousands of retail trend-followers are forced to stop out, while breakout algorithms simultaneously flood the market with sell orders. To trade this safely, professionals wait for a confirmed candle to close completely outside the line, or they execute a sell limit order upon a clean structural retest of the broken line from underneath.
To maximize your success rate with both bounces and breakouts, you must optimize your strategy for real-world execution environments.
Optimizing trendline trading in real XM conditions
Optimizing trendline trading in real XM conditions requires pairing your diagonal price patterns with highly accurate mathematical indicators and professional risk management protocols to insulate your account from false breakouts.

Relying purely on visual lines without secondary momentum filters reduces your technical edge to a coin-flip during volatile global news releases. Combining your geometry with quantitative tools ensures you only deploy capital when both price structure and market momentum are fully synchronized.
Which indicators work best with trendlines?
To maximize your strategy’s forecasting accuracy, always combine your trendlines with these three complementary technical studies:
- The Relative Strength Index (RSI): Look for overbought/oversold momentum conditions or hidden RSI divergence exactly when price taps your trendline to confirm an immediate bounce.
- The 200-Period Simple Moving Average (SMA): Use the 200 SMA as a macro directional filter; only draw and trade bullish support lines when the asset is trading safely above the 200 SMA.
- The MACD Oscillator: Monitor for an official MACD signal line crossover to validate that market velocity has fully shifted in your favor before entering a breakout trade.
By anchoring your lines to these quantitative filters, you can easily protect your portfolio from the most common retail fakeout traps.
How to manage risk when trading with trendlines?
Managing risk requires calculating your position sizing precisely based on the distance between your entry price and your structural stop-loss, while keeping your total risk exposure to a conservative 1% to 2% of account equity per trade. Because sudden geopolitical news can cause prices to gap past your lines, you should utilize automated trailing stops to lock in floating profits as the trend accelerates. Furthermore, by accessing the advanced execution tools and expert technical updates provided directly on the MBroker homepage, you can easily ensure your account configuration features optimal execution speeds to eliminate slippage when your risk thresholds are triggered.
In short, Trendlines Trading is a mandatory skill for isolating market direction, mapping institutional liquidity pools, and executing highly asymmetric risk-to-reward setups. By drawing lines across extreme wick wicks, waiting for a minimum of 3 structural touches to validate symmetry, and filtering your breakouts with the RSI or 200 SMA, you can easily remove execution guesswork.

Thoren Vextal is a specialist in XM trading guides, offering practical insights and real-market experience to help traders improve their strategies and trading performance. Email: [email protected]