
 Tiếng Việt
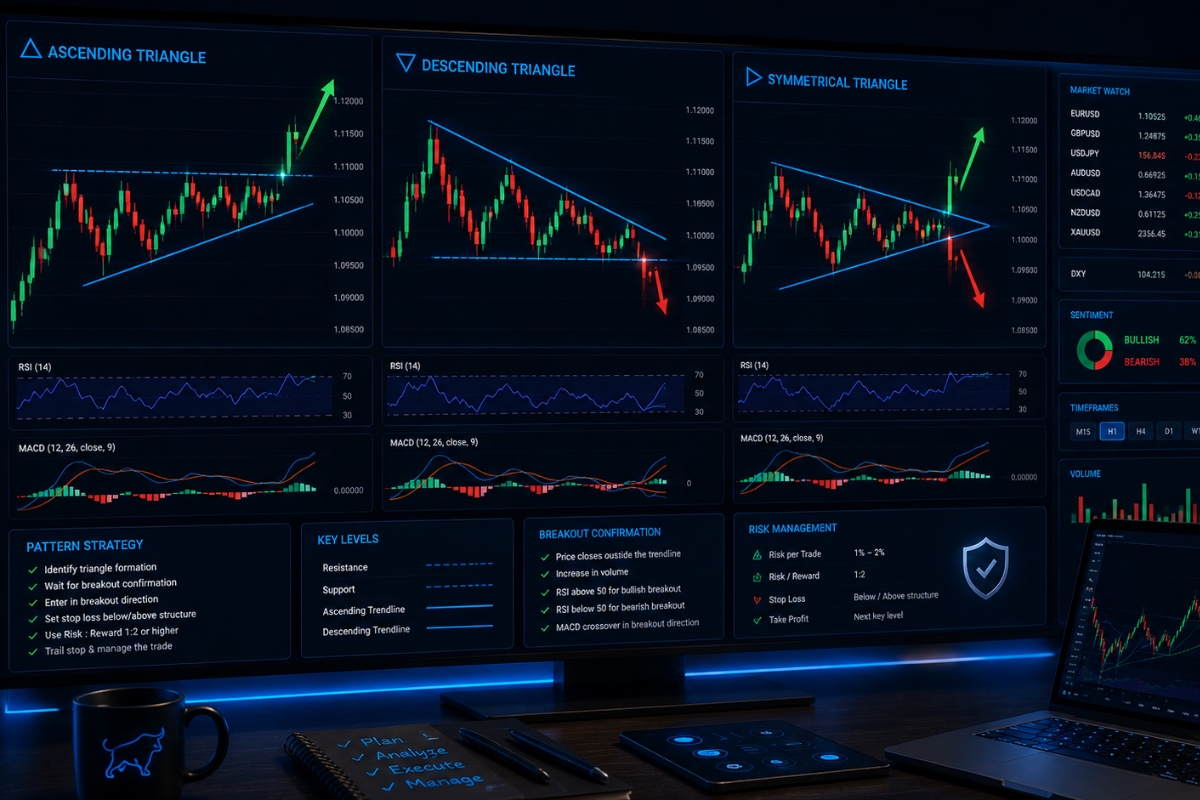
Triangle patterns are formed by converging trendlines that create a tightening price range, indicating market consolidation before a potential breakout.
There are three main types: ascending, descending, and symmetrical triangles, each reflecting different market biases such as bullish, bearish, or neutral conditions.
However, breakout signals occur when the price moves beyond the triangle boundary with strong momentum, while false breakouts can happen without volume confirmation.
Therefore, the core strategy is to enter trades after confirmed breakouts and set stop loss outside the pattern, with take profits based on the triangle’s height.
Additionally, triangle patterns can be applied across forex, stocks, and crypto markets, making them versatile tools for identifying continuation or reversal opportunities.
Understanding triangle patterns helps you identify more precise entry points. Explore the Forex Technical Analysis category to improve your trading skills.
Triangle pattern structure in trading markets
The structure of a triangle pattern represents a localized balance of power, with the market forming converging support and resistance lines, causing price action to compress into a tight apex.
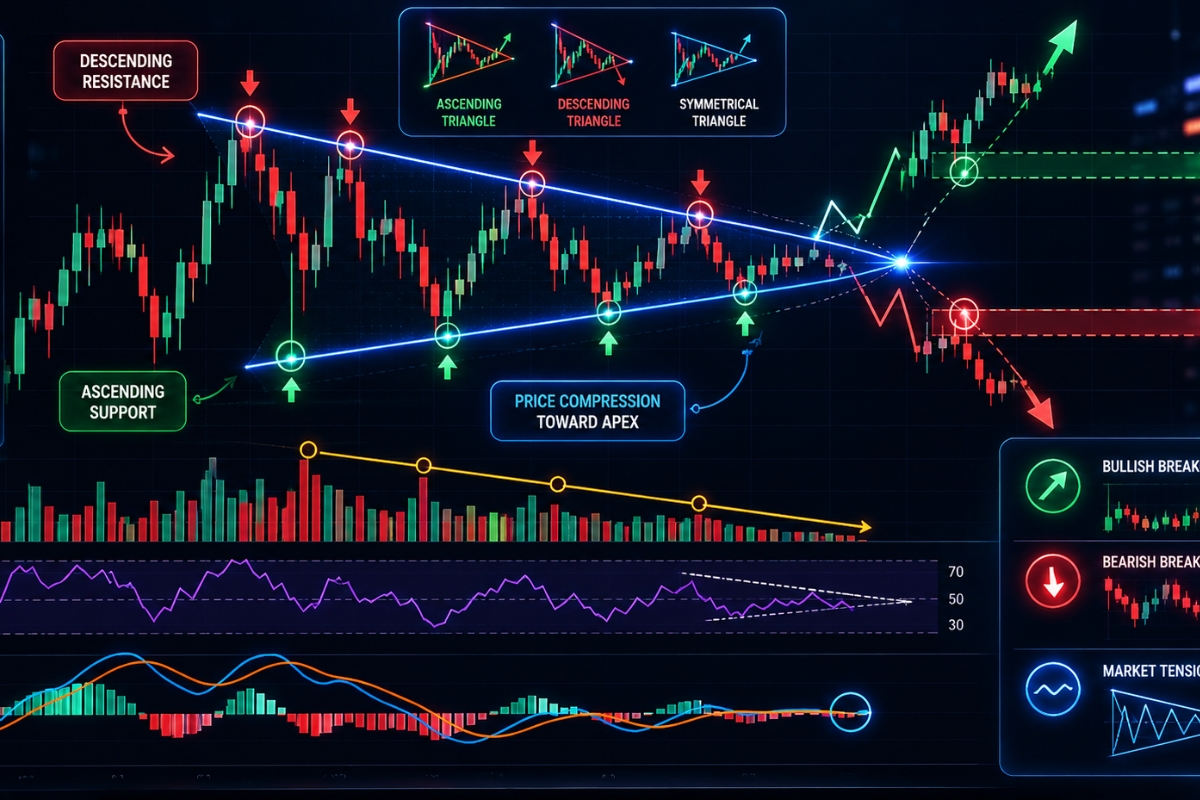
Statistically, this compression indicates a temporary equilibrium between buyers and sellers, where trading volume typically decays by 30% to 50% as the pattern nears its conclusion. Institutional traders highly value this coiled-spring environment because it serves as a reliable leading indicator of a major, high-velocity breakout.
How is a triangle pattern structured?
A triangle pattern is structured by drawing two converging trendlines: a descending or horizontal upper resistance line and an ascending or horizontal lower support line. To validate geometry, the price action must touch each of these boundary lines at least twice (creating a minimum of four distinct structural pivot points). As the price moves back and forth between these boundaries, the distance between the highs and lows narrows toward a point known as the apex.
This structural narrowing is not just a visual phenomenon; it reveals a profound shift in market participant psychology.
What does triangle structure indicate about market behavior?
The contracting structure indicates a state of market indecision and strategic accumulation. As the price bounces between support and resistance, both bulls and bears are unwilling to push the market to new absolute extremes, resulting in a temporary standoff. This compression signifies that liquidity is being trapped within the pattern, and smart money is building large positions in anticipation of a massive directional release.
Once you can identify this foundational shape, you must learn to classify the specific variations that dictate market direction.
Triangle patterns types in forex and stock trading
Traders primarily interact with three major variations of triangle patterns: Symmetrical, Ascending, and Descending triangles, each carrying unique directional biases.
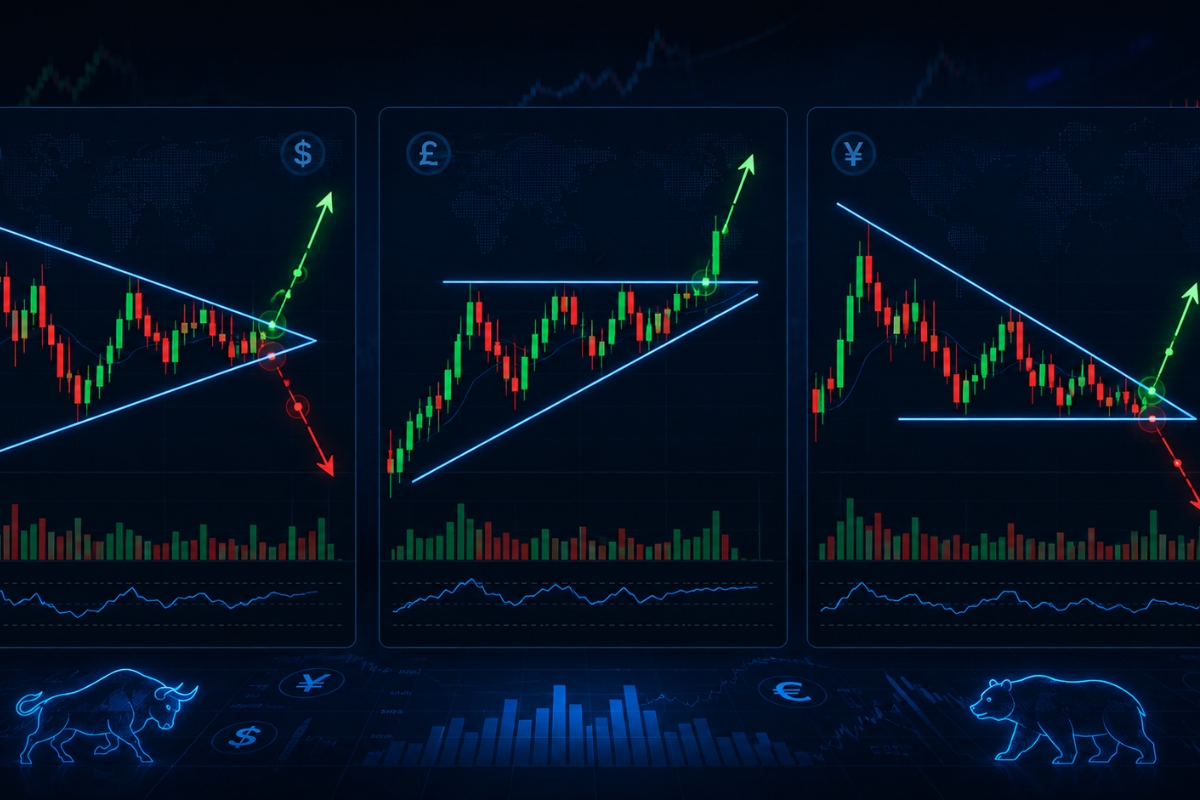
Symmetrical triangles represent a neutral battleground where both sides push equally, while Ascending triangles feature a flat top showing hidden buying pressure, and Descending triangles display a flat bottom indicating aggressive distribution. Understanding these distinctions allows investors to adjust their execution models before a breakout even starts.
What are the main triangle pattern types?
The three primary variations are distinguished by the angles of their defining trendlines:
- Symmetrical Triangles: Formed by a descending resistance line and an ascending support line meeting at a symmetrical angle. It is generally viewed as a continuation pattern.
- Ascending Triangles: Characterized by a flat, horizontal upper resistance ceiling and a rising lower support line. This structure carries a strong bullish bias.
- Descending Triangles: Built with a flat, horizontal lower support floor and a declining upper resistance line. This structure carries a strong bearish bias.
While geometry remains constant, the underlying asset class can alter the performance metrics of these shapes.
How do triangle patterns behave in forex vs stocks?
In the Forex market, triangles frequently resolve as continuation structures because currency pairs are inherently mean-reverting and driven by macroeconomic interest rate differentials.
In the stock market, however, ascending triangles on daily charts exhibit a higher structural win rate due to the natural upward bias of equity indices over time. Traders utilizing the data feeds at XM Guide note that volume analysis is much more precise in stocks, whereas Forex requires a strict reliance on price action and volatility indicators.
No matter the asset class, the ultimate key to profitability rests on your ability to accurately read the breakout signal.
Signals and breakout confirmation triangle pattern
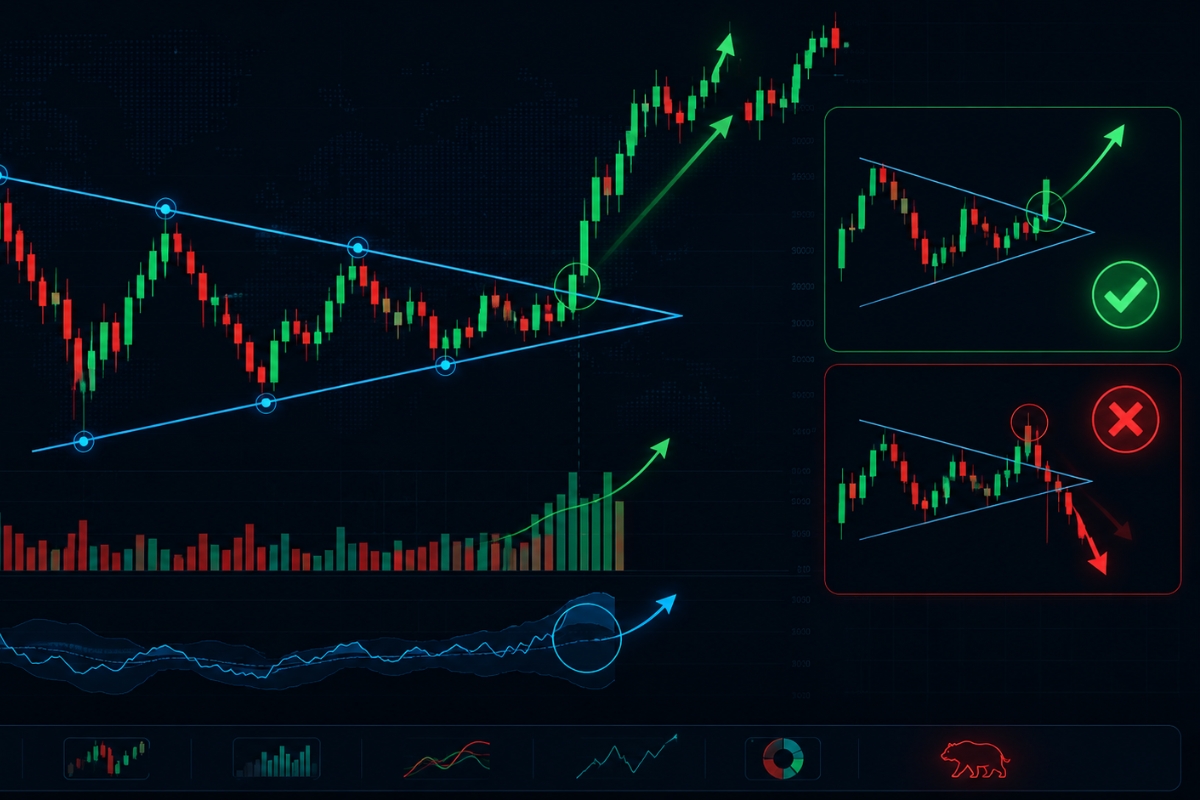
A valid triangle pattern signal is triggered when a candlestick breaks cleanly through either the upper resistance ceiling or the lower support floor. To prevent entering during a market trap, a professional breakout confirmation requires a candlestick to close entirely outside the pattern boundary on a significant timeframe (such as the 1-Hour or 4-Hour chart). Statistically, entering purely on a line touch without waiting for the candle to close reduces strategy accuracy by nearly 40%.
How to identify breakout signals in triangle patterns?
A high-probability breakout signal manifests through a distinct combination of structural changes:
- The Candlestick Close: A decisive close beyond the trendline boundary, rather than just a temporary wick extension.
- Momentum Expansion: An immediate increase in average true range (ATR), indicating that stop-loss orders are cascading and fueling the move.
- Volume Surge: In equity and crypto spaces, a breakout must be accompanied by an above-average volume spike to prove institutional backing.
Failing to spot these confirmation metrics often leaves retail accounts vulnerable to devastating whipsaw movements.
What are common false breakout signals?
A common false breakout, or “bull/bear trap,” occurs when the price aggressively pierces a trendline, traps breakout traders, and immediately reverses back inside the triangle structure. These false signals are usually characterized by long candlestick wicks, low trading volume during the break, and a lack of follow-through on subsequent candles. Understanding these traps is a core focus of the educational resources provided by MBroker, helping traders wait for confirmed retests before risking capital.
Once you can confidently identify verified signals, you can safely deploy a step-by-step execution strategy.
Strategy for trading execution triangle patterns
Executing a systematic strategy for Triangle Patterns removes emotional bias by relying on pre-calculated entry points, protective stops, and mathematical profit targets. The core philosophy of this strategy is to capture the initial surge of volatility that occurs when the pattern’s compression phase snaps. By applying a strict mathematical rule to your targets, you ensure a highly favorable risk-to-reward profile over a large series of trades.

How to trade triangle patterns step by step?
Follow this detailed mechanical process and risk framework to manage your triangle entries with institutional discipline.
- Step 1: Identify triangle structure: Locate a market in consolidation and map the converging trendlines using at least two swing highs and two swing lows.
- Step 2: Wait for breakout confirmation: Patience is mandatory; wait for a complete candlestick body to close outside the boundary of the triangle lines.
- Step 3: Enter trade in breakout direction: Execute a market order immediately upon the breakout candle’s close, or set a limit order at the breached trendline to catch a structural retest.
- Step 4: Set Stop Loss outside pattern: For a bullish breakout, place your Stop Loss just below the most recent minor swing low inside the triangle. For a bearish break, place it right above the last minor swing high.
- Step 5: Set Take Profit based on pattern height: Measure the absolute vertical distance of the widest part of the triangle (the base). Project this exact pip or dollar value from the breakout point to establish your definitive profit target.
While execution is straightforward, long-term survival depends entirely on the parameters of your risk engine.
How to manage risk when trading triangles?
Advanced risk management for triangle trading requires an unyielding commitment to capital preservation:
- Fixed Position Sizing: Never risk more than 1% to 1.5% of your total account balance on any individual triangle setup.
- Asymmetric Risk Profiles: Only accept trades where the projected measured move offers a minimum of a 1:2 Risk-to-Reward ratio.
- Breakout Failure Management: If a breakout candle closes back inside the opposite side of the triangle, manually terminate the position early to minimize losses.
With your strategy fully optimized, we can examine how these principles perform when applied across various live asset classes.
Applying triangle patterns in real trading scenarios
Applying triangle patterns across diverse real-world trading environments requires minor adjustments to account for specific asset class nuances and liquidity conditions.

In hyper-liquid spaces like Forex, these patterns provide clean, technical continuations, whereas in volatile spaces like Cryptocurrency, they can lead to extreme liquidity sweeps before resolving. Recognizing these environmental traits ensures that your technical edge remains sharp regardless of the chart you are analyzing.
How are triangle patterns used in forex trading?
In Forex, traders utilize triangles to ride major macroeconomic trends, particularly in pairs like EUR/USD, GBP/USD, and USD/JPY. Symmetrical triangles frequently form during the quiet Asian session, setting up massive breakout opportunities during the London and New York session opens. Because the Forex market operates 24/5, these structures provide continuous setups that align perfectly with the automated tools and liquidity access highlighted on the MBroker platform.
While Forex is highly continuous, applying these exact same shapes to stocks and crypto introduces a few unique structural variables.
How to apply triangle patterns in stocks and crypto?
When trading equities, ascending triangles are excellent for spotting corporate accumulation before positive earnings releases, and traders must watch for morning “gaps” that can bypass your entry price.
In cryptocurrency markets (such as Bitcoin or Ethereum), triangles develop rapidly on 1-Hour and 4-Hour charts; however, due to high retail participation, these patterns experience more volatile “fakeouts” near the apex. To combat this, crypto analysts combine triangle trendlines with a volume oscillator to ensure the breakout is driven by real capital rather than speculative noise.
In summary, Triangle Patterns are elite technical tools that turn market consolidation into highly structured, profitable trading opportunities.

Thoren Vextal is a specialist in XM trading guides, offering practical insights and real-market experience to help traders improve their strategies and trading performance. Email: [email protected]