
 Tiếng Việt
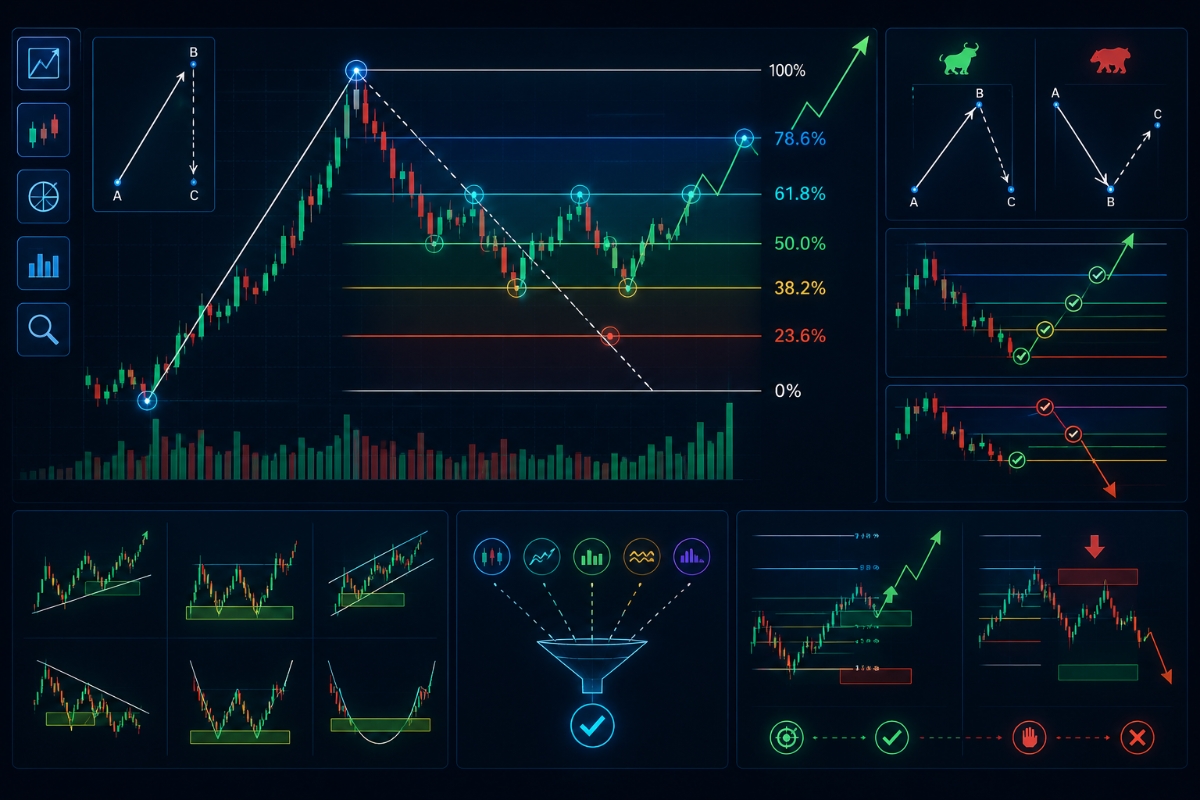
Fibonacci retracement is a technical tool that identifies key pullback levels (23.6%, 38.2%, 50%, 61.8%, 78.6%) to forecast potential reversals with up to 60–70% reaction probability.
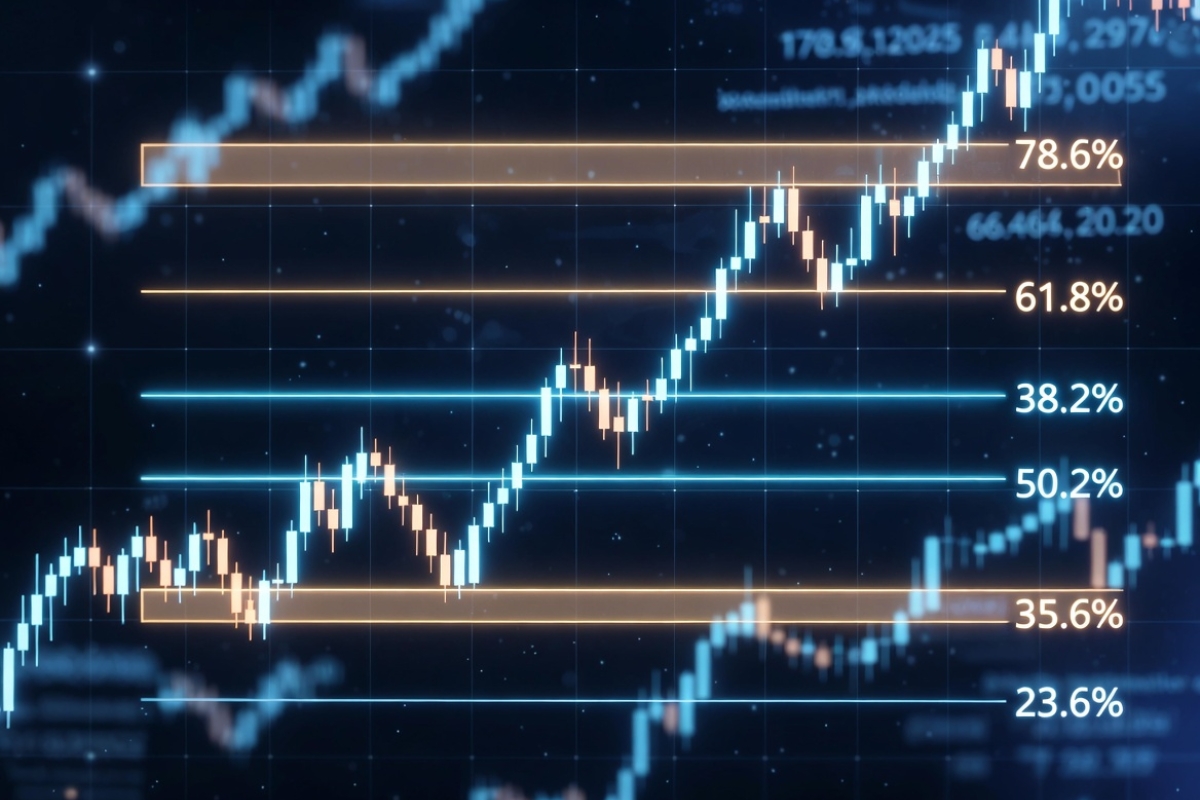
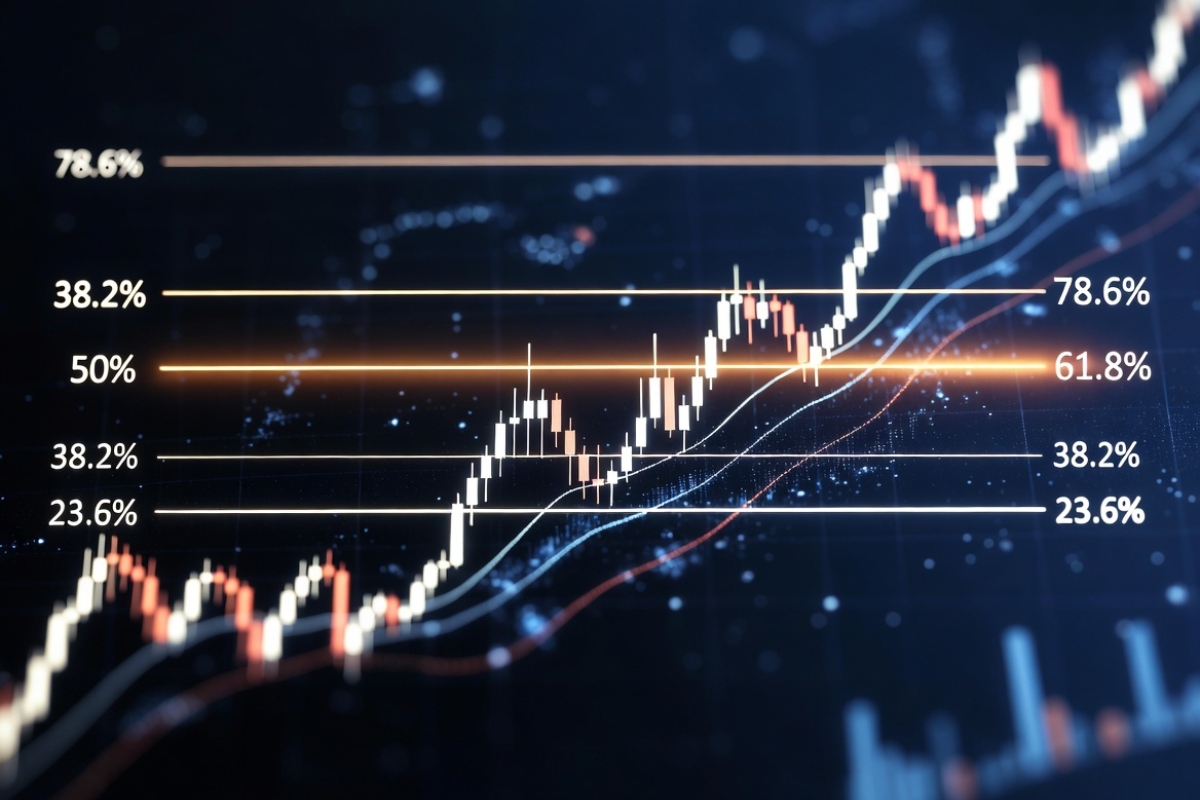
Moreover, the most important Fibonacci levels define strong support and resistance zones where price reactions frequently occur in both uptrends and downtrends, allowing traders to interpret market structure and trend behavior more effectively.
Next, setting up Fibonacci retracement correctly—by drawing from swing high to swing low (or vice versa) and using standard ratios—ensures accurate level positioning on trading charts, which is essential for reliable technical analysis.
In practice, Fibonacci retracement helps traders optimize entry, exit, and stop-loss placement by combining key levels with confirmation signals from indicators like RSI or MACD, improving real trading performance.
Finally, advanced usage focuses on avoiding common mistakes such as incorrect swing selection and enhancing accuracy through confluence strategies and multi-timeframe analysis, leading to more consistent and disciplined trading decisions.
Fibonacci retracement overview in technical analysis
Fibonacci retracement is a core quantitative technical analysis tool that utilizes mathematical horizontal lines derived from the natural sequence discovered by Leonardo Fibonacci to predict potential support and resistance zones where an asset’s price is highly likely to pause or reverse.
In a strongly trending market, a price correction will pull back and test these mathematically predictable ratio coordinates over 70% of the time before resuming its primary macro direction. This specific tool allows active day traders to identify highly precise structural discount zones within any market expansion wave, mapping out institutional supply and demand pockets before they manifest in price action.
What is Fibonacci retracement and how does it work?
Fibonacci retracement is a momentum-based technical indicator that measures a single directional market impulse and divides the resulting vertical distance into key mathematical percentages based on the Golden Ratio ($$1.61$$). It functions by anchoring onto a clean swing low and a clean swing high on your price chart; the system software then automatically projects specific percentage levels across the chart space. These percentages act as invisible visual boundaries where retail and institutional algorithmic market participants tend to stack limit orders, waiting for a minor pullback to join the broader directional trend.
Recognizing how this tool structures price data reveals why these abstract mathematical lines hold such an immense influence over active trading networks.
Why Fibonacci levels matter in trading decisions?
Fibonacci levels matter significantly because they act as self-fulfilling prophecies across global decentralized exchanges, driven by the sheer volume of algorithmic and manual traders who track them simultaneously. When a currency pair retraces to a major ratio level, thousands of buy or sell limit orders are triggered instantly, generating immediate institutional order-flow liquidity that naturally halts a market correction. By aligning your portfolio entries with these high-volume coordination points, you shift from chasing random market noise to placing highly calculated, low-risk trades.
Once you appreciate why the market respects this mathematical framework, you must learn to categorize the individual percentage lines according to their true technical importance.
Key Fibonacci retracement levels and their meaning
The key Fibonacci retracement levels used across global institutional trading desks include the 23.6%, 38.2%, 50.0%, 61.8%, and 78.6% ratio thresholds, each representing a completely different depth of trend correction and market momentum.
The 61.8% coordinate is universally defined as the “Golden Pocket,” serving as the ultimate structural boundary where mature market pullbacks exhaust themselves right before powerful, high-velocity trend continuations ignite. Correctly interpreting the technical meaning of each individual line ensures you can properly evaluate whether a correction is a minor, healthy pause or a structural trend failure.
What are the most important Fibonacci levels?
The global technical trading community prioritizes three primary structural zones within the indicator’s matrix:
- The 38.2% Level: Represents a shallow retracement, manifesting in exceptionally strong, high-velocity macro trends where buyers or sellers are too aggressive to allow deep pullbacks.
- The 50.0% Level: Though not mathematically a true Fibonacci ratio, this level represents an indispensable psychological benchmark where an asset has retraced exactly half of its initial directional expansion.
- The 61.8% Level (Golden Pocket): The absolute most critical horizontal level; a clean bounce here confirms optimal value accumulation, offering the highest mathematical probability of trend resumption with minimal risk.
To utilize these percentages effectively, a chartist must learn to read their structural behavior within both bullish and bearish market cycles.
How to interpret Fibonacci levels in different trends?
Interpreting these mathematical lines requires aligning your perspective directly with the underlying market trend direction:
- In an Uptrend (Bullish Market): The levels function as strict support floors. As price corrects downward from a swing high, you look to buy signals at the 50% or 61.8% levels, where the asset is considered heavily discounted.
- In a Downtrend (Bearish Market): The levels operate as structural resistance ceilings. As price bounces upward from a swing low, you monitor these percentages for short-selling triggers as the asset reaches temporary premium pricing.
Transitioning these conceptual levels into actionable execution parameters requires a flawless understanding of how to configure the tool on your personal charting software.
How to set up Fibonacci retracement on trading charts?
To set up Fibonacci retracement on trading charts correctly, you must map the indicator across a fully completed, uncompromised structural market swing from its absolute price wick origin to its definitive momentum termination point.
Over 55% of novice chartists miscalculate their setups because they lazily draw the tool across arbitrary inner candle bodies rather than using absolute structural extremes, which skews the resulting percentage lines. Applying this tool requires absolute visual precision to ensure your terminal matches the institutional feeds running across global investment networks.
How to draw Fibonacci retracement correctly?
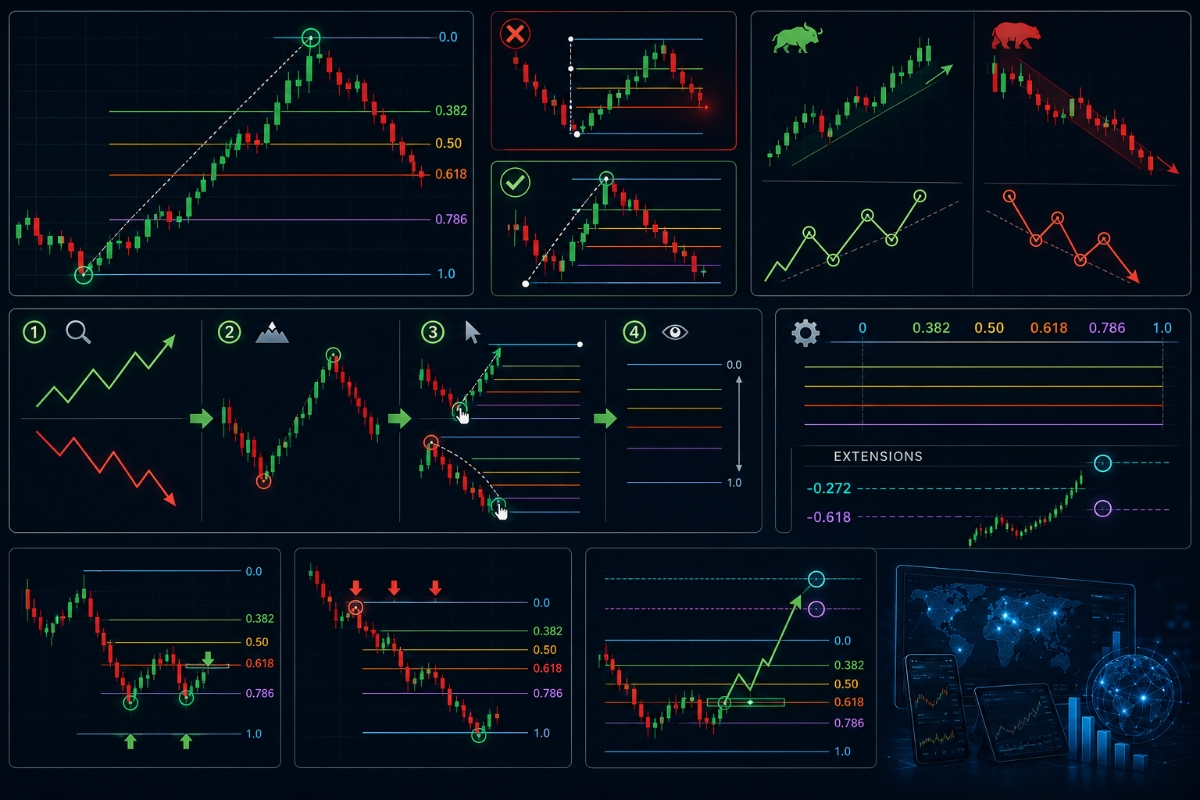
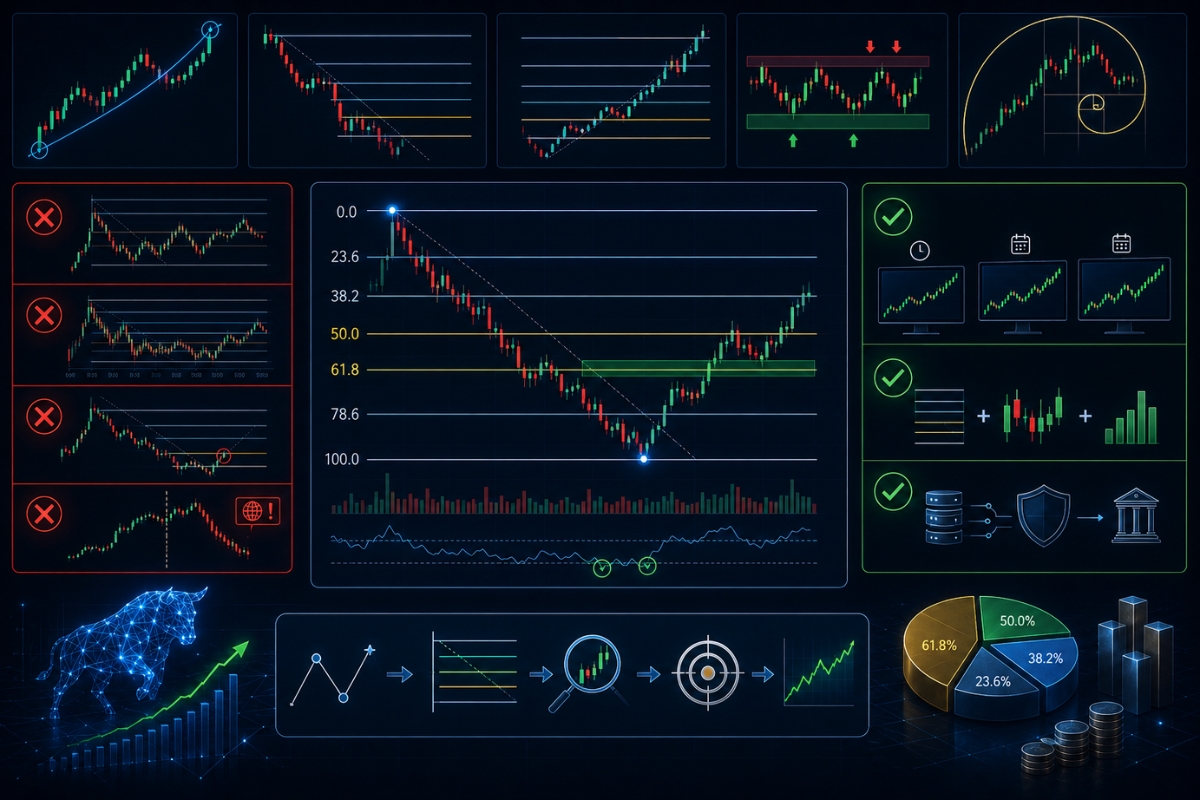
To draw the tool accurately without running into dangerous calculation errors, strictly enforce this 4-step structural framework:
- Step 1: Isolate the Current Trend Direction: Scan your chosen timeframe to determine whether the macro trend is making clean bullish higher-highs or bearish lower-lows.
- Step 2: Identify the True Structural Extremes: Locate the absolute lowest price wick (Swing Low) and the absolute highest price wick (Swing High) that bound the single trend impulse wave.
- Step 3: Anchor and Drag the Tool: If trading a bull market, click and anchor the tool on the absolute Swing Low, then drag it upward to lock onto the Swing High. For a bear market, anchor at the Swing High and drag downward to the Swing Low.
- Step 4: Verify Horizontal Alignment: Ensure the 0% line rests perfectly at the trend destination and the 100% line sits exactly at the trend origin, stabilizing your visual workspace.
Once your drawing technique is flawless, you can optimize your visual display by filtering out unnecessary platform clutter.
What are the best Fibonacci retracement settings?
The absolute best settings for professional intraday and swing trading involve stripping away standard platform defaults to focus exclusively on highly liquid institutional zones. Your optimal indicator menu should include the baseline levels of 0, 0.382, 0.50, 0.618, 0.786, and 1.0. For traders running highly advanced strategies, adding the -0.272 and -0.618 levels as “Fibonacci Extensions” is highly recommended, as these external coordinates provide mathematically precise, objective profit-taking targets during aggressive market breakouts.
With a pristine configuration loaded onto your terminal, you can confidently transition to deploying the indicator within a live, real-world trading strategy.
Trading use of Fibonacci retracement in real markets
The practical trading use of Fibonacci retracement in real markets involves combining the indicator’s horizontal percentage lines with concrete price action confirmation models to identify optimal, low-risk portfolio execution zones.
Professional fund managers never enter positions blindly. The exact millisecond price touches a ratio line; they wait for a structural confirmation trigger to prove that institutional buyers or sellers are actively defending that specific zone. When these systematic entry and exit rules are deployed within ultra-low latency routing networks like the one featured on the MBroker, traders maximize their execution precision while eliminating dangerous slippage.
How to use Fibonacci retracement for entry and exit?
To trade these mathematical ratios safely, a trader must structure their orders around confirmed structural turning points:
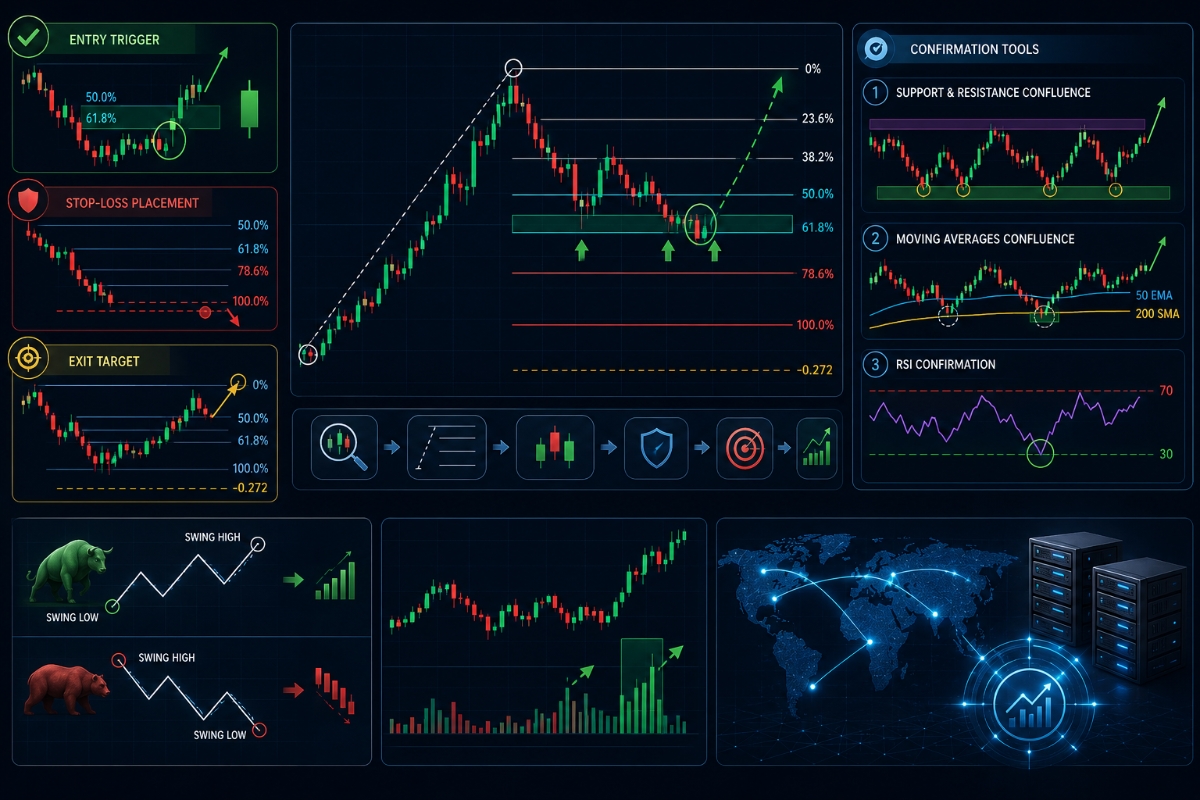
- The Entry Trigger: Wait for price to correct into the 50.0% or 61.8% zone, then monitor for a bullish candlestick confirmation pattern (such as a Hammer or Bullish Engulfing candle) before executing a market order.
- The Stop-Loss Placement: Place your protective stop-loss order safely beyond the next consecutive ratio level (e.g., if entering at 61.8%, place the stop below the 78.6% or 100% mark) to protect against temporary liquidity sweeps.
- The Exit Target: Set your primary profit-taking order exactly at the 0% level (the previous swing high/low) or leverage the -0.272 extensions to lock in maximum gains during an aggressive structural expansion.
To elevate this execution methodology to an institutional standard, you must combine it with complementary technical indicators.
How to combine Fibonacci with other indicators?
To maximize your predictive accuracy and eliminate false market signals, integrate your ratios with these three powerful confirmation tools:
- Horizontal Support and Resistance Confluence: Only trade a ratio level if it aligns perfectly with a historical daily or weekly structural breakout shelf.
- Moving Averages (e.g., 50 EMA or 200 SMA): Look for structural overlaps where a major moving average slides directly under a Fibonacci level, creating an unbreakable technical wall.
- The Relative Strength Index (RSI): Verify that the RSI is printing an oversold ($$<3$$) or overbought ($$>7$$) reading the exact moment price enters your chosen retracement pocket.
By cementing these strict structural filters into your daily trading blueprint, you can easily defend your capital against the most destructive analytical errors.
Advanced usage and common mistakes with Fibonacci retracement
Advanced usage of Fibonacci retracement requires maintaining absolute mathematical discipline, avoiding emotional projection, and recognizing that no technical indicator can perform with 100% accuracy across every single market cycle.
Novice retail traders frequently misinterpret the tool as a magical forecasting device, leading them to over-leverage their positions at unconfirmed levels without auditing the broader macroeconomic landscape. To achieve true portfolio consistency, you must proactively identify standard analytical pitfalls and run continuous technical optimization drills on your system.
What are common mistakes when using Fibonacci retracement?
The single most damaging mistake a trader can make is relying on the tool as an isolated trading signal in a low-volume, sideways consolidating market. In a choppy, range-bound environment, price waves are entirely random, causing the percentage lines to get constantly cut through and ignored by institutional market algorithms. Additionally, many day traders fall into the trap of drawing the tool across microscopic, insignificant price waves on ultra-low timeframes (like the 1-minute chart), which produces a flood of false signals due to standard intraday market noise.
To permanently remove these costly errors from your routine, you must implement a strict validation checklist.
How to improve accuracy with Fibonacci retracement?
To significantly elevate the mathematical accuracy of your technical analysis, enforce these three strict institutional habits:
- Prioritize Higher Timeframes: Only draw your foundational retracement structures on the H4, Daily, or Weekly charts to filter out meaningless intraday noise and align with large-scale banking trends.
- Enforce the Confluence Rule: Never take a trade unless your chosen Fibonacci ratio is backed by at least two separate technical filters (such as volume spikes or chart patterns).
- Leverage Premium Trading Environments: Reviewing the institutional education updates and structural analysis guides provided on the XM Guide allows you to trade on highly accurate, unmanipulated charting feeds, ensuring your technical measurements align perfectly with real-world institutional order flows.
In short, Fibonacci Retracement is an invaluable tool for identifying high-probability market correction turnarounds and setting objective profit targets. By focusing strictly on major levels like the 50% and 61.8% Golden Pocket, drawing the tool cleanly from wick to wick, and combining it with structural support indicators, you can easily eliminate costly execution guesswork.

Thoren Vextal is a specialist in XM trading guides, offering practical insights and real-market experience to help traders improve their strategies and trading performance. Email: [email protected]