
 Tiếng Việt
Volume analysis delivers market insight, forex application, key types, and core indicators, helping traders confirm trends and improve accuracy (up to 20–30%).
Next, volume reflects market insight through trading activity and sentiment, where high volume confirms strength and low volume signals weakness or indecision.
Moreover, volume analysis in forex relies on tick volume, breakout confirmation, and divergence, though accuracy is limited due to decentralized market data.
In addition, volume analysis includes trading volume, tick volume, and cost-volume-profit models, each serving different analytical purposes.
Finally, volume indicators like OBV, Volume, and Volume Oscillator support trading decisions on platforms such as MetaTrader and TradingView.
Volume analysis is a core component of Forex Technical Analysis, helping traders understand market strength, validate price movements, and detect potential reversals. Traders can gain deeper insight into market behavior and improve decision-making in real trading conditions.
Volume analysis in trading and market context
Volume analysis is the technical practice of examining the total number of shares, contracts, or lots traded within a specific timeframe to validate trend strength and price momentum.

True market volume represents the fuel of price delivery; an upward price move backed by a 50% or higher surge in volume confirms aggressive institutional participation. Integrating transaction metrics into your analytical framework allows you to determine whether a price movement is a sustainable trend or an artificial retail liquidity trap before committing your capital.
What is volume analysis in forex trading?
In forex trading, volume analysis measures the intensity of market activity by tracking either tick volume (the frequency of price changes) or real volume data provided by specific liquidity pools. Because the foreign exchange market is decentralized without a single centralized clearinghouse, forex volume measures the absolute rate of order placement across interconnected banking servers. This metric allows day traders to verify whether a sudden currency breakout is backed by large institutional order flow or simply random market noise.
Understanding this structural tracking logic helps explain why transactional metrics are universally respected by professional analysts.
Why is volume important in financial markets?
Volume is incredibly important in financial markets because it acts as a leading indicator of liquidity, consensus, and institutional commitment. According to classical Wyckoff market theory, price movements require transactional effort; a large price breakout on low volume reveals an absence of institutional support, making the move highly unstable. By monitoring whether volume is expanding or contracting, you gain the ability to predict imminent trend exhaustion, identify structural accumulation zones, and anticipate explosive price breakouts with high mathematical probability.
Once you understand its core importance, you can use these metrics to extract actionable insights regarding broader market psychology.
Market insight from volume analysis
Volume analysis provides direct market insight by exposing the hidden balance of power between aggressive institutional buyers and urgent sellers behind every candlestick pattern.

Matching a price spread with its corresponding transaction size allows you to instantly determine if big money is buying the dip or distributing its positions to retail accounts. This transparency strips away the deception of naked price charts, giving you a clear view of the structural transitions that occur between market accumulation and distribution phases.
What does high and low volume indicate?
Varying volume profiles serve as a direct measurement of institutional commitment and market interest:
- High Volume: Indicates strong institutional consensus, heavy commercial order matching, and a highly stable environment where price trends are actively sustained by deep liquidity.
- Low Volume: Signals market hesitation, a lack of commercial interest, and an unstable environment where prices can easily be manipulated by minor order book imbalances.
Recognizing these basic profiles allows you to decode the underlying psychological bias of the dominant market players.
How does volume reveal market sentiment?
Volume reveals market sentiment by showing whether the prevailing trend is driven by genuine conviction or structural exhaustion:
- Bullish Conviction: Price climbs higher while volume steadily expands, proving that buyers are aggressively chasing prices upward and absorbing all available overhead supply.
- Bearish Capitulation: Price plunges sharply while volume spikes to extreme levels, indicating a panic-driven sell-off where retail accounts liquidate positions into institutional buy limits.
- Buying Exhaustion: Price makes a new high but volume drops significantly, revealing a lack of buyer follow-through that typically precedes a major market crash.
Translating these broad insights into specific execution rules requires tailoring your analytical framework to the unique decentralized environment of currency trading.
Forex application of volume analysis
The forex application of volume analysis relies on tracking real-time price tick frequency to accurately gauge institutional order flow and validate structural support and resistance boundaries.

Because over $7.5 trillion shifts through the international banking system daily, tracking how aggressively these contracts change hands allows retail traders to trade in perfect alignment with global market makers. When you apply this transaction-filtering logic to your daily workflow, you can drastically minimize costly false breakout entries and optimize your exit targets.
How to use volume analysis in forex trading?
To accurately apply transaction metrics to your live forex executions, follow this definitive 4-step institutional framework:
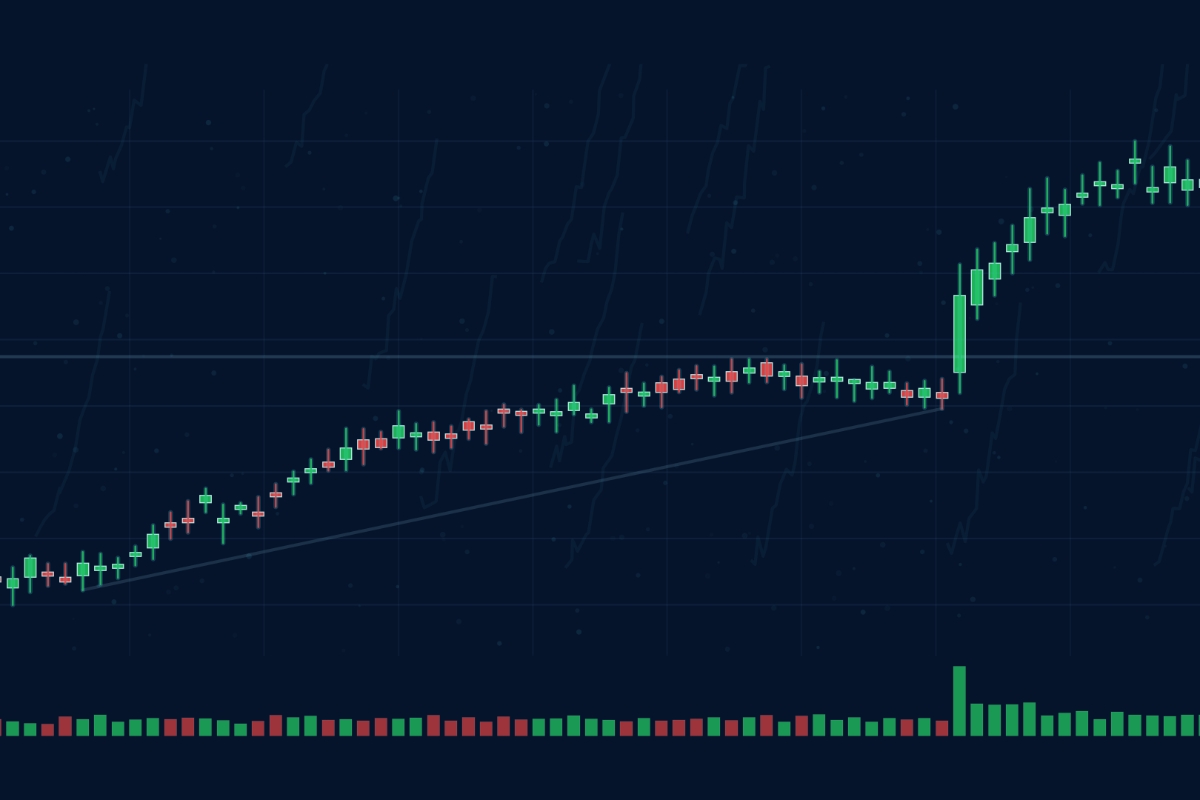
- Step 1: Locate a Structural Consolidation Pattern: Identify a clear geometric setup, such as an Ascending Triangle or a horizontal range floor, on your chart.
- Step 2: Monitor for Volume Expansion: Watch the volume bars; look for a sudden volume spike that registers at least 50% higher than the preceding 10-period average as price approaches the boundary line.
- Step 3: Confirm the Breakout Candle Close: Ensure the daily or four-hour candle closes completely outside the pattern threshold while volume remains high, confirming a valid institutional breakout.
- Step 4: Execute Your Position: Enter the trade in the direction of the breakout, placing your protective stop-loss safely inside the broken structural pattern.
While this system is highly effective, achieving mastery requires a clear understanding of the unique data characteristics of the forex network.
What are limitations of volume in forex?
The primary limitation of volume analysis within the forex market is the lack of a centralized, single global volume repository. Because currency pairs trade over-the-counter (OTC), standard brokers cannot show you the total aggregate volume of every bank in the world simultaneously. Instead, retail terminals rely on Tick Volume—which tracks how frequently price fluctuates within a specific candle—serving as a 90% accurate proxy for real transactional volume, provided you source your feed from a well-capitalized provider.
To maximize your analytical accuracy despite these structural limits, it is highly useful to review the different operational types of volume tracking.
Types of volume analysis in trading
The primary types of volume analysis in trading include time-based volume (Vertical Volume), price-based volume (Horizontal Volume Profile), and corporate-focused cost-profit-volume metrics.
Combining vertical bars with horizontal volume profiles allows you to pinpoint the exact price coordinates where the largest institutional blocks were processed. Utilizing these different dimensions of market data ensures you map out structural supply and demand zones with absolute precision.
What are the main types of volume analysis?
Active technical day traders primarily utilize two independent types of structural transaction mapping:
- Vertical Volume: The standard bar chart located at the bottom of your screen, displaying the total number of transactions executed during a specific time interval (e.g., a 1-hour candle).
- Volume Profile (Horizontal Volume): An advanced charting overlay that displays the total accumulated volume executed at a specific price level over a given timeframe, highlighting the “Point of Control” (POC) where institutional liquidity is densest.
While these tools are designed purely for active price tracking, they must never be confused with internal corporate accounting metrics.
How does cost profit volume analysis differ from trading volume?
Cost-Profit-Volume (CPV) analysis is a corporate managerial accounting model that measures how changes in production costs and sales volumes affect a company’s net operating profit. CPV focuses entirely on internal corporate variables like fixed costs, variable pricing, and break-even units. Conversely, Trading Volume is a purely technical market metric that tracks external, real-time public exchange transactions, serving as a direct gauge of speculative market liquidity and institutional order matching speed.
Once you can separate these professional concepts, the final step involves selecting the best technical indicators to automate your chart analysis.
Volume indicators and tools for traders
Volume indicators and tools for traders translate raw transaction data into clean, visual lines and mathematical oscillators that reveal hidden institutional accumulation or distribution.
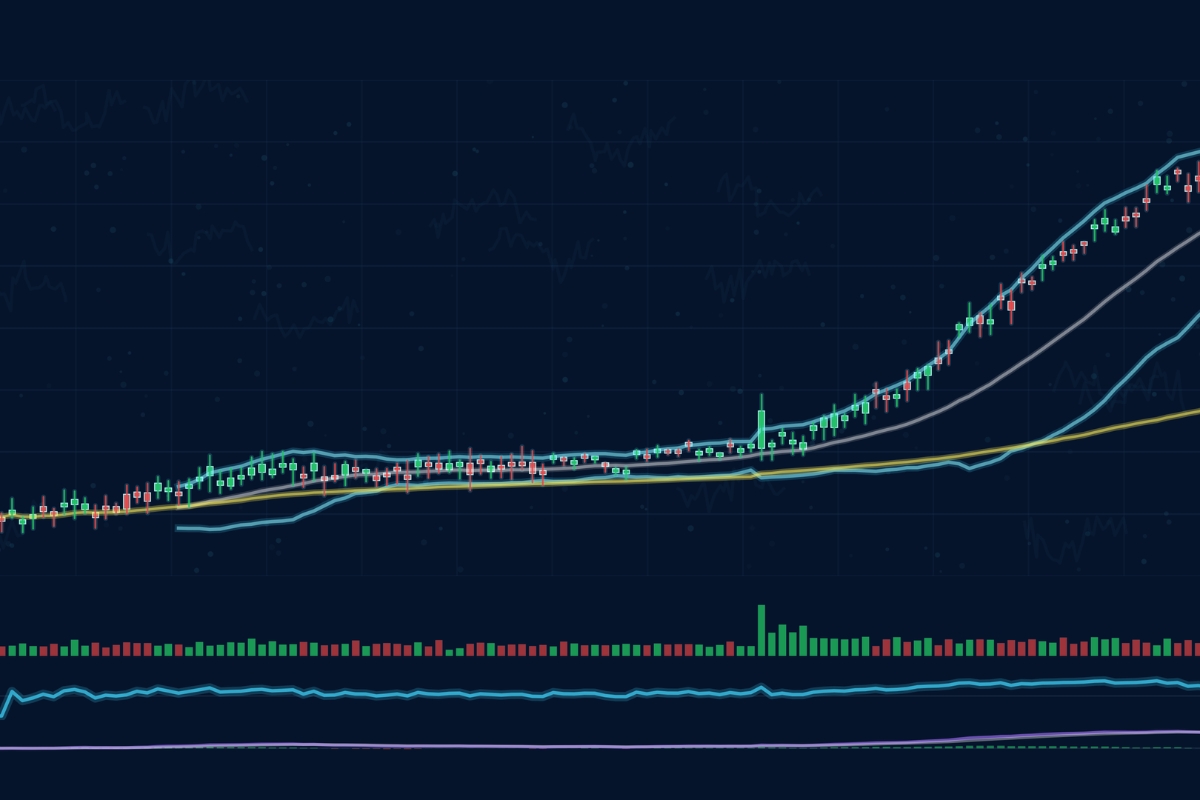
Relying on verified algorithmic indicators removes manual bias, allowing you to quickly scan multiple asset classes for hidden momentum divergence or structural breakouts. When these advanced data tools are paired with the premium execution environment and tight spreads found on the MBroker, traders can safely execute high-probability setups with absolute technical efficiency.
What are the most popular volume indicators?
To automate your transactional market analysis, you should integrate these three time-tested indicators into your system:
- On-Balance Volume (OBV): A cumulative momentum indicator that adds volume on up-days and subtracts it on down-days, revealing whether smart money is quietly accumulating an asset.
- Chaikin Money Flow (CMF): An indicator that measures the volume-weighted average of accumulation and distribution over a specified period, keeping your strategy aligned with institutional capital.
- Volume-Weighted Average Price (VWAP): A critical intraday baseline used by large institutional algorithms to execute major orders at the true average value of the trading session.
To ensure these advanced indicators calculate your data accurately, you must run them on a highly reliable charting infrastructure.
What platforms support volume analysis?
Advanced volume analysis and horizontal volume profile modeling are fully supported by top-tier modern trading terminals, including MetaTrader 5 (MT5), TradingView, and customized institutional broker interfaces. These platforms offer seamless multi-feed integration, allowing you to apply advanced volume indicators directly to your favorite currency pairs without experiencing data lag. By cross-referencing your indicator data with the real-time broker updates and expert education resources featured on the MBroker, you can easily ensure your trading setup is fully optimized for the global marketplace.
In short, Volume Analysis is a vital tool for confirming trend sustainability, identifying institutional order blocks, and protecting your capital from false breakouts. By combining vertical volume bars with horizontal profiles, utilizing indicators like OBV, and verifying that breakouts are backed by volume expansion, you can easily remove execution guesswork. To track live institutional order flow, access advanced technical charting features, and trade with ultra-low latency, start optimizing your daily trading strategy today on the MBroker.

Thoren Vextal is a specialist in XM trading guides, offering practical insights and real-market experience to help traders improve their strategies and trading performance. Email: [email protected]