
 Tiếng Việt
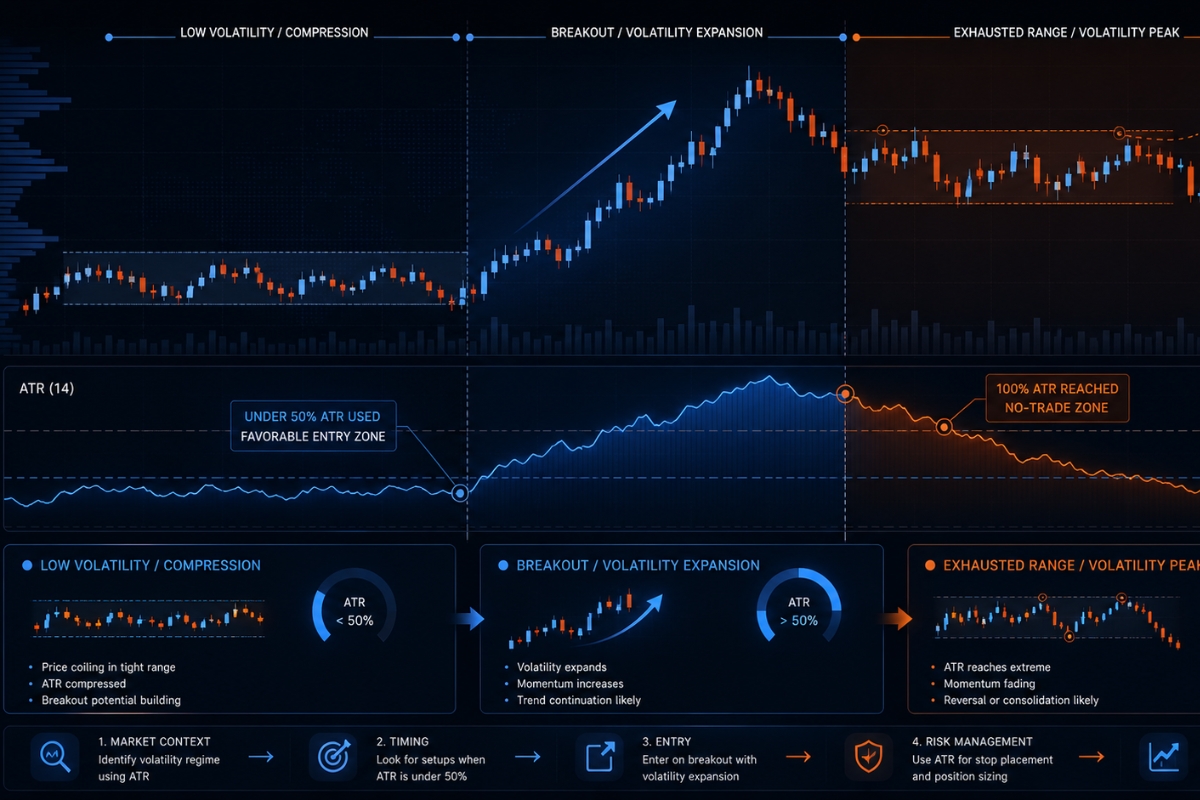
ATR measures market volatility cycles by quantifying price movement expansion and contraction. Traders identify when the market is entering high-volatility (trending) or low-volatility (sideways) phases.
ATR helps calculate position size based on volatility to control risk per trade, allowing traders to adjust lot size so that each trade maintains a consistent risk percentage regardless of market conditions.
Additionally, ATR signals optimal trade timing by highlighting volatility breakouts and quiet periods, helping traders enter during expansion phases and avoid low-momentum markets.
Therefore, ATR directly influences trade execution decisions by adapting strategies to current market volatility, ensuring stop loss, take profit, and entry levels align with real market conditions.
However, ATR does not indicate price direction and must be combined with other indicators, making it essential to use alongside trend or momentum tools for accurate decision-making.
Understanding ATR (Average True Range) correctly helps traders measure market volatility, optimize entry points, and manage risk more effectively. To improve your practical skills, read the detailed in-depth guides in the XM Guide section to build a systematic trading strategy.
ATR (Average True Range) in market volatility cycles
The ATR indicator tracks market volatility cycles by measuring the average range between a security’s high and low prices over a specific period, typically 14 days.

Unlike momentum oscillators, ATR does not provide directional signals; instead, it mathematically maps out whether the market is in a state of high-intensity price expansion or low-intensity compression. Statistically, financial assets cycle between these two states, and a rising or falling ATR line offers a precise numerical blueprint of these structural shifts.
What are volatility cycles in financial markets?
Volatility cycles represent the natural alternation between periods of relative price stability and aggressive price movement across global exchanges. Financial markets exist in a continuous loop: low volatility inevitably leads to high volatility as institutional orders accumulate, and high volatility eventually cools down into consolidation as profit-taking concludes. Identifying where an asset sits within this cycle is crucial because trading strategies that thrive in quiet markets will quickly fail during explosive expansions.
Understanding this cyclical rhythm allows us to use ATR as a primary parsing tool to classify current market conditions.
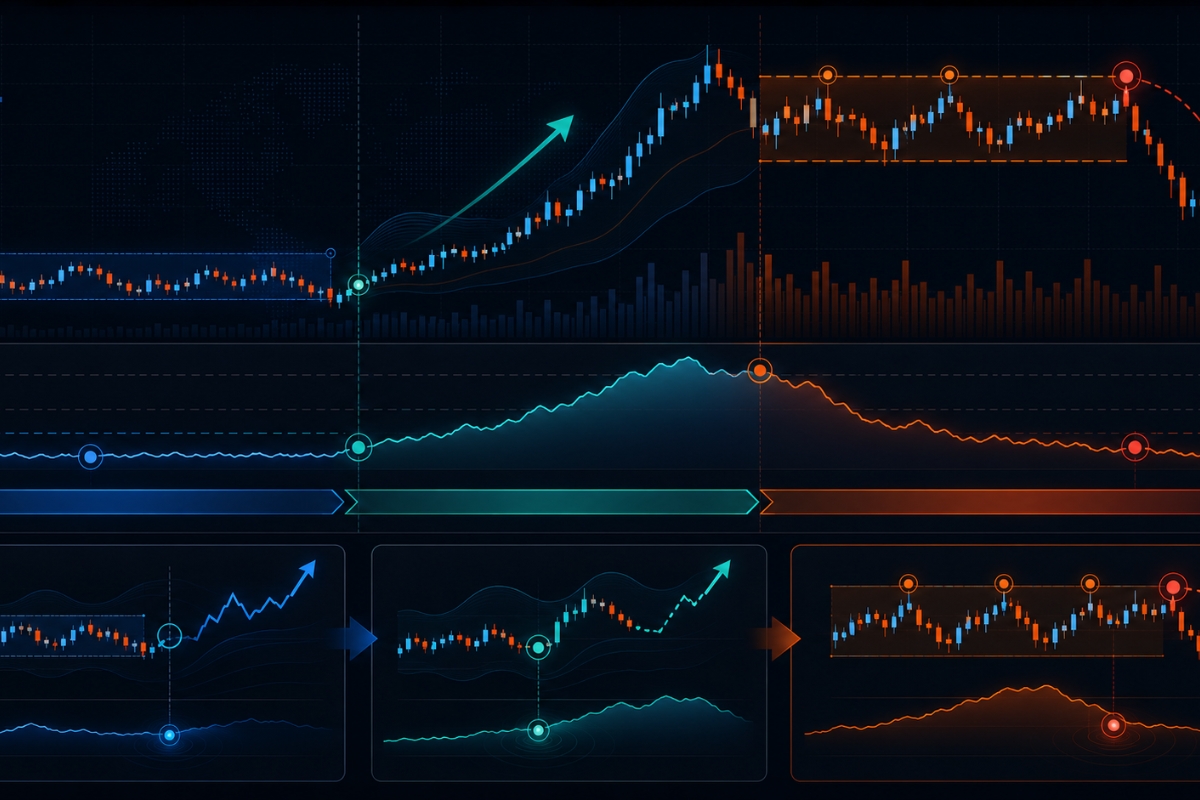
How does ATR identify expansion and contraction phases?
ATR identifies expansion and contraction phases by measuring the expanding or shrinking dimensions of recent price candles.
- Contraction Phase: When the ATR value trends downward toward multi-month or multi-year lows, it proves that daily candle ranges are shrinking, indicating a market squeeze or consolidation.
- Expansion Phase: A sharp upward turn in the ATR line confirms that daily trading ranges are expanding, signaling an influx of institutional volume and the birth of a powerful new breakout trend.
Once a financial analyst maps out the underlying volatility cycle, the next step is applying those metrics directly to protect trading capital.
ATR and position sizing in trading risk management
ATR-based position sizing is a foundational pillar of institutional risk management, adjusting trade volumes dynamically based on real-time market turbulence.
Instead of risking a generic, fixed number of lots on every trade, professional money managers use the current ATR value to calculate a custom trade size for each specific market environment. This mathematical approach guarantees that a trader risks an identical dollar amount regardless of whether they are entering a calm, low-volatility asset or a highly chaotic, high-volatility market.
How to calculate position size using ATR?
To calculate your exact position size using the ATR indicator, follow this strict three-step formula:
- Define Capital Risk: Determine the absolute dollar amount you are willing to lose on the trade (e.g., $$1\$$ of a $\$$50,00$$ account = $\$$50$$).
- Determine Stop Loss Distance: Set your structural stop loss as a multiple of ATR, typically $$2 \times \text{ATR$$ (e.g., if Daily ATR is 0.0080 pips, your Stop Loss is $$16$$ pips).
- Execute the Formula: Apply the standard equation:
- Position Size = Account Risk ( $ ) / Stop Loss Distance (pips) x Pip Value
By adapting your trade size using this exact math, you ensure your risk exposure remains totally standardized across changing market conditions.
While the calculation is clear, understanding the broader philosophical reasoning behind it highlights its institutional importance.
Why is ATR important for capital management?
ATR is vital for capital management because it eliminates emotional bias and prevents catastrophic “drawdowns” during unexpected market shifts. If a trader utilizes a static stop-loss distance during a high-volatility expansion, their stop will likely be triggered prematurely by random market noise. Conversely, by expanding stop distances and shrinking position sizes during high-ATR environments, users at MBroker can give their trades adequate breathing room while keeping their net financial risk perfectly contained.
With your structural risk neutralized through adaptive position sizing, you can safely turn your focus toward optimizing the exact timing of your market entries.
ATR for trade timing and market entry conditions
ATR directly optimizes trade timing by acting as a mechanical filter that prevents traders from chasing exhausted price moves or entering markets during low-probability conditions.
In financial execution, timing is not just about choosing a direction; it is about assessing whether the market has enough remaining energy to reach a designated profit target. By comparing the current intraday price travel to the daily ATR, traders can make objective decisions about whether an entry condition is mathematically favorable.
When should traders enter based on ATR behavior?
Traders should seek market entries when the ATR indicator is breaking out of a long-term bottom or when the intraday price has consumed less than $$50\$$ of its total daily ATR value.
- The Breakout Entry: A sudden uptick from a multi-week low in ATR signals a fresh release of momentum, making it the ideal time to trade trend-following or breakout strategies.
- The Intraday Entry: If the daily ATR is $$10$$ pips and the market has only moved $$3$$ pips so far today, there is a high mathematical probability that the price has enough residual energy to move another $$40-5$$ pips toward your target.
Conversely, analyzing the opposite spectrum of the indicator’s behavior highlights when it is safest to step away from the order book.
When should traders avoid trading with ATR?
Traders must completely avoid opening new positions when the current price movement has already equaled or exceeded $$100\$$ of its historical daily ATR value. When an asset hits its average range limit for the day, the trend becomes structurally exhausted, leaving minimal liquidity to push the move further and exposing late entrants to severe mean-reversion pullbacks. Furthermore, during ultra-low ATR compressions, range-bound traders should avoid entering trend strategies, as the price will lack the momentum required to yield clean breakouts.
Understanding how to time your entries prepares you to manage the trade through execution and cross-market adaptation.
ATR in trade execution and market adaptation
ATR plays a pivotal role in trade execution decisions by dictating the optimal placement of trailing stops, profit targets, and order routing methods.

Because different assets possess entirely unique structural baselines, using rigid, fixed-pip rules across multiple markets leads to systemic underperformance. Integrating ATR data into your execution layout ensures that your orders are structurally calibrated to adapt to the unique internal rhythm of whatever asset you are currently trading.
How does ATR affect trade execution decisions?
ATR impacts trade execution by shifting boundaries from static levels to dynamic, volatility-adjusted zones.
- Stop Placement: Professional platforms automatically set trailing stops at a multiple of ATR (e.g., $$3 \times \text{ATR$$ Chandelier Exits) to prevent being stopped out by standard market noise.
- Target Calibration: Profit targets are capped within the boundaries of the daily ATR to ensure realistic fill probabilities.
- Order Selection: In high-ATR environments, market orders face heavy slippage risk, prompting professional desks to switch exclusively to limit orders to lock in exact pricing.
While these execution concepts are universal, their practical values shift heavily when moving between asset classes.
How does ATR behave differently in forex, stocks and crypto?
ATR data behaves differently across asset classes due to structural variations in liquidity, leverage, and trading hours:
| Asset Class | ATR Behavioral Profile | Practical Management |
| Forex | Highly consistent, stable ATR cycles driven by macroeconomic sessions. | Ideal for long-term trailing stops. |
| Stocks | Prone to sudden ATR gaps at the market open due to overnight corporate news. | Requires widening ATR filters to counter gaps. |
| Crypto | Hyper-extended ATR expansions with massive, prolonged spikes during liquidations. | Requires real-time position downsizing. |
By utilizing the educational data and advanced analytical streams provided on the MBroker homepage, traders can easily monitor these cross-market adjustments in real-time.
Limitations of ATR in financial decision making
Despite its immense tactical utility, the ATR indicator possesses distinct limitations that can result in systemic misinterpretations if used in complete isolation.

Because ATR is calculated exclusively from historical high-and-low data, it functions entirely as a lagging metric that cannot predict the exact direction of an incoming breakout or anticipate a sudden macroeconomic policy shift. Recognizing these technical blindsides is essential for transforming a basic technical tool into an institutional-grade trading system.
What are the weaknesses of ATR indicator?
The primary operational weaknesses of the ATR indicator include:
- No Directional Bias: ATR only measures the magnitude of volatility; it cannot tell you whether a massive expansion will break to the upside or downside.
- Lagging Data Design: Because it uses a standard 14-period moving average, ATR can react slowly to sudden, black-swan market reversals, initially underreporting risk.
- Illiquidity Distortions: In illiquid markets, wide bid-ask spreads can artificially inflate the ATR value, painting a false picture of actual trading activity.
Acknowledging these blind spots allows us to implement secondary filters to build a pristine, complete analytical matrix.
How to combine ATR with other trading tools?
To maximize accuracy, always combine ATR with complementary directional and structural tools:
- Trend Indicators (Moving Averages): Use a 200 EMA to establish the primary directional bias, then use ATR strictly to manage stop losses and position sizes in that verified direction.
- Structural Zones (Support/Resistance): Look for low-ATR contractions forming directly against historical weekly support levels; this combination provides an elite, high-probability breakout setup.
- The Professional Standard: Integrating these ATR filters with the institutional order-flow insights and strategy frameworks found on MBroker allows you to trade with an unmatched technical advantage.
In summary, the ATR indicator is an indispensable utility for any serious trader, acting as a dynamic compass for market volatility, risk containment, and execution timing. By abandoning fixed-pip rules and allowing the real-time ATR value to dictate your position sizing and target placement, you effectively immunize your portfolio against erratic market shifts.

Thoren Vextal is a specialist in XM trading guides, offering practical insights and real-market experience to help traders improve their strategies and trading performance. Email: [email protected]