
 Tiếng Việt

Ichimoku Indicator is a complete trading system that combines trend, momentum, and support/resistance in one indicator, allowing traders to analyze the market quickly without using multiple tools.
Ichimoku measures trend through the Kumo cloud and price position relative to it, where price above the cloud indicates an uptrend and below signals a downtrend.
Additionally, Ichimoku evaluates momentum using Tenkan-sen and Kijun-sen crossovers, helping traders identify the strength and continuation of price movements.
A valid Ichimoku trade setup combines trend direction, momentum signals, and cloud confirmation, ensuring higher probability entries when all conditions align.
However, Ichimoku can generate delayed signals in ranging markets, so traders need proper risk management and confirmation from other tools to avoid false entries.
The Ichimoku Indicator is considered one of the most comprehensive tools for traders to measure the market with a single system. To learn how to use Ichimoku effectively, refer to the in-depth guides in the XM Guide section to build a solid trading foundation.
Ichimoku indicator and market measurement role
The Ichimoku indicator serves as a unified market measurement system that defines equilibrium by tracking the relationship between current prices and historical averages.

Unlike single-line moving averages, Ichimoku measures five distinct components—Tenkan-sen, Kijun-sen, Senkou Span A, Senkou Span B, and Chikou Span—to map out the entire structural layout of the market grid. Statistically, it eliminates the need for secondary filters by rendering a comprehensive “one-glance” overlay that identifies whether a market is trending, consolidating, or on the verge of a volatile breakout.
What does Ichimoku measure in financial markets?
The Ichimoku indicator measures four critical dimensions of market data: core trend direction, dynamic support and resistance zones, velocity of momentum, and historical confirmation. It calculates these metrics by plotting the midpoints of specific historical price ranges rather than simple closing price averages:
- Tenkan-sen (Conversion Line): Measures short-term equilibrium by averaging the highest high and lowest low over the past 9 periods.
- Kijun-sen (Base Line): Tracks medium-term equilibrium based on a 26-period range.
- Senkou Span A & B (Leading Spans): Form the boundaries of the Kumo (Cloud), measuring future support and resistance projected 26 periods ahead.
- Chikou Span (Lagging Line): Measures current closing prices shifted 26 periods backward to confirm market sentiment.
This unique combination of retrospective, real-time, and prospective data points explains why the tool stands out among modern technical indicators.
Why is Ichimoku considered a complete trading system?
It is considered a complete system because it solves the classic trader’s dilemma of lagging indicators by providing a forward-looking perspective via the Kumo Cloud. While standard indicators require you to look at three separate windows for trend, volume, and momentum, Ichimoku unifies these functions on a single price chart. For professional traders globally, including strategic partners at MBroker, this comprehensive overlay reduces cognitive overload and provides a mathematically verified framework that handles filtering, execution, and exit management without external add-ons.
Once the overall layout is mastered, we can isolate its primary operational function: tracking structural trend shifts.
Trend measurement using Ichimoku in trading
Trend measurement using Ichimoku hinges on the position of the current price relative to the Kumo Cloud, which serves as the ultimate behavioral boundary of the market.
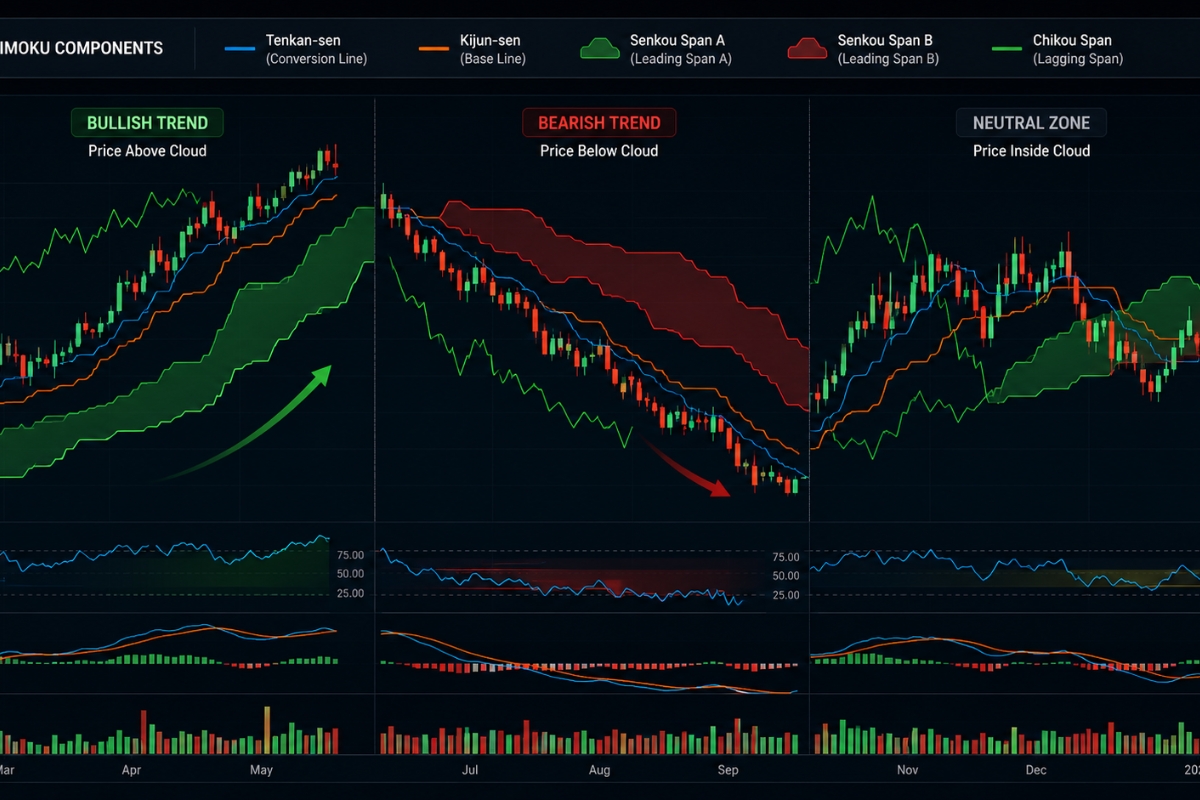
When the price trades continuously above the cloud, the market is in a confirmed bullish phase; when it trades below the cloud, a bearish trend is technically active. If price action penetrates deep into the cloud structure, it indicates an equilibrium zone characterized by high volatility, trend indecision, and a flat trading range.
How does Ichimoku define market trends?
Ichimoku defines market trends through an absolute structural hierarchy based on the alignment of its components:
- Bullish Alignment: Price is above the Cloud, the Tenkan-sen is positioned above the Kijun-sen, the Cloud is colored green (Span A > Span B), and the Chikou Span is clear above the historical price candles.
- Bearish Alignment: Price is below the Cloud, the Tenkan-sen is below the Kijun-sen, the Cloud is red (Span B > Span A), and the Chikou Span is free below the historical price structure.
- Neutral State: Price trades inside the boundaries of the Cloud, signaling a lack of directional commitment where trend-following strategies should be avoided.
When these components align perfectly, the next structural step is gauging the sustainability and power of that movement.
When is a trend considered strong in Ichimoku?
A trend achieves maximum strength when all five lines move in structural harmony, and the angle of the Tenkan-sen and Kijun-sen steepens significantly. Furthermore, a thick Kumo Cloud indicates strong, deeply embedded support or resistance that institutional orders are actively defending. If the distance between the price and the Kijun-sen expands excessively, it warns of an overextended market, but as long as the lines remain parallel without crossing, the trend is highly secure.
While trend analysis establishes your core direction, tracking localized momentum shifts provides the optimal timing for entries.
Momentum analysis with Ichimoku indicator
Momentum analysis with the Ichimoku indicator relies heavily on the interactions, crossovers, and spacing between the Tenkan-sen (Conversion Line) and Kijun-sen (Base Line).
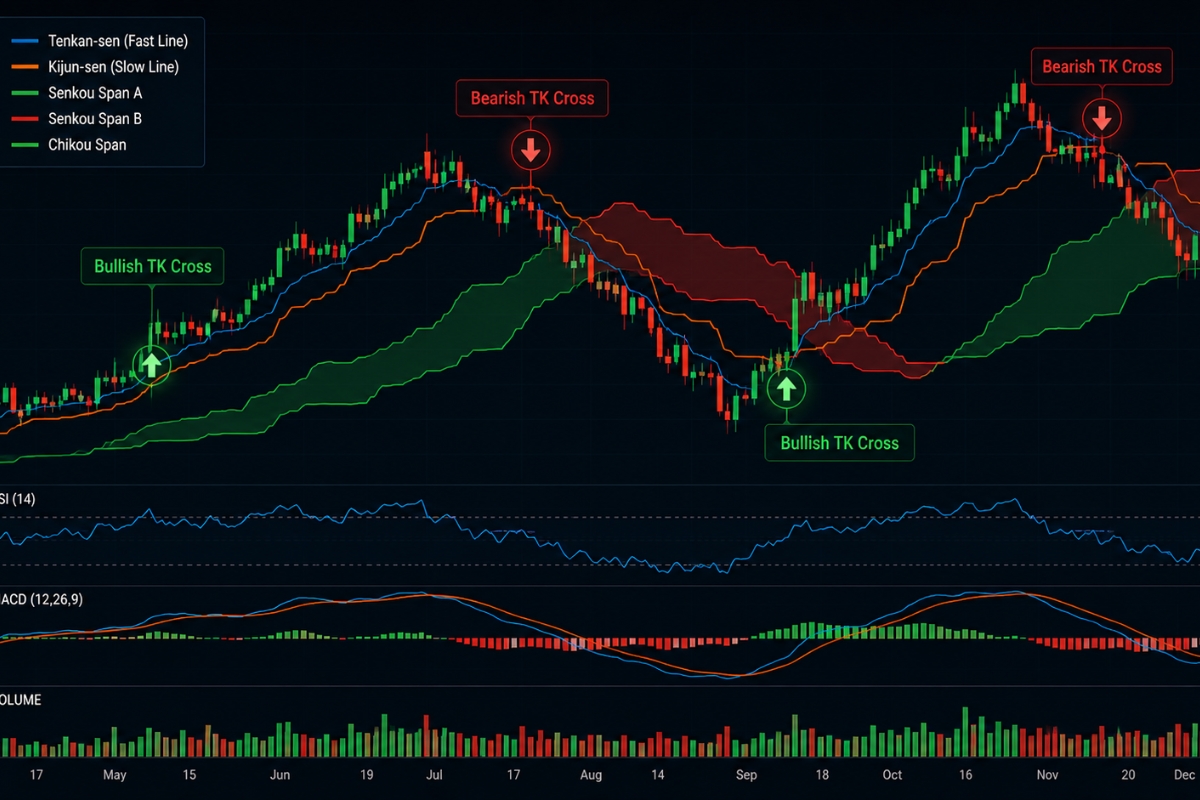
The Tenkan-sen reacts rapidly to recent price fluctuations, its position relative to the slower Kijun-sen functions as a dynamic momentum oscillator laid over the actual price candles. When these two lines widen or compress, they reveal changes in market velocity before those changes alter the broader trend structure.
How does Ichimoku measure momentum?
Ichimoku measures momentum through the TK Cross mechanism, which tracks when the short-term conversion line cuts through the medium-term base line:
- Bullish Momentum Trigger: Occurs when the Tenkan-sen crosses above the Kijun-sen, signaling a rapid acceleration in buying velocity.
- Bearish Momentum Trigger: Occurs when the Tenkan-sen crosses below the Kijun-sen, indicating a dominant shift toward selling pressure.
- Strength Classification: A cross that occurs above the cloud is a strong bullish signal, whereas a cross that occurs inside the cloud is classified as a weak or neutral momentum signal.
Understanding the internal speed of a market is a critical metric that helps filter out bad trades in volatile asset classes.
Why is momentum important in forex and crypto trading?
Momentum tracking is vital because both Forex and Cryptocurrency markets are prone to sudden liquidity shocks and intense momentum expansions. In Forex, momentum shifts pinpoint the sudden entry of central bank orders during major economic releases, while in Crypto, it highlights aggressive retail FOMO or institutional accumulation. Experienced market analysts at MBroker emphasize that trading without momentum confirmation often leaves you trapped in slow, decaying consolidation cycles that bleed premium and capital.
With trend parameters and momentum metrics firmly established, we can synthesize these elements into a rule-based execution strategy.
Trade setup using Ichimoku in real market conditions
A trade setup using Ichimoku in real market conditions transforms raw structural data into an actionable, rule-based execution model that leaves no room for emotional bias.

Because the system tracks multiple layers of data, a valid setup requires a specific convergence of factors before capital is put at risk. By waiting for these elements to align, you ensure that you are trading with the path of least resistance, backed by institutional liquidity and confirmed market momentum.
What defines a valid Ichimoku trade setup?
A valid, high-probability Ichimoku setup – often called the “Five-Bullet Setup” – requires all five components to simultaneously confirm the directional bias. For a long trade, the price must have broken cleanly out of the Kumo Cloud, a bullish TK Cross must be active, the future cloud must be expanding in a bullish orientation, and the lagging Chikou Span must be unhindered by historical candle structures. If even one of these components fails to validate the move, the setup is considered incomplete and should be filtered out.
To make this practical, let’s look at the mechanical execution sequence required to take a trade from start to finish.
How to build a trading setup with Ichimoku?
To build a functional, step-by-step trading routine using this system, implement the following operational timeline:
- Identify the Core Breakout: Scan for a candlestick that closes entirely outside the outer boundary of the Kumo Cloud.
- Verify the TK Alignment: Confirm that the Tenkan-sen and Kijun-sen are crossed in your intended trade direction.
- Check the Lagging Filter: Ensure the Chikou Span has a clear runway, completely free of structural obstacles from 26 periods ago.
- Execute the Entry: Open your market position immediately upon the close of the breakout candle, or place a limit order at the Kijun-sen for a retest entry.
- Establish Risk Boundaries: Position your Stop Loss safely on the opposite side of the Kumo Cloud or just below the Kijun-sen line.
- Define Profit Horizons: Set your Take Profit targets based on major historical levels or trail your position along the Kijun-sen line until a counter-cross occurs.
While this mechanical approach delivers exceptional clarity, a defensive trader must always evaluate the limitations of their tools.
Risk and limitations of Ichimoku in trading
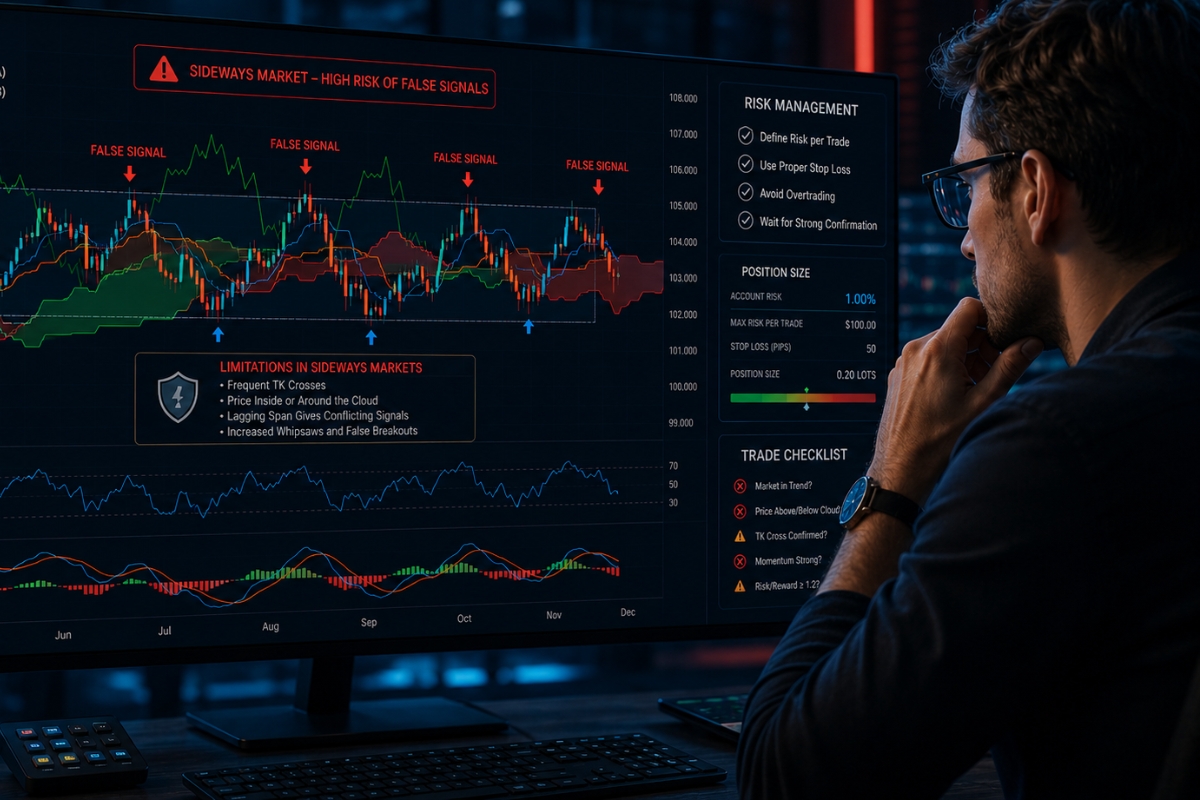
Risk and limitations of Ichimoku in trading stem primarily from its reliance on historical range midpoints, which can cause the indicator to lag or generate false signals during choppy, non-trending market conditions. Because the calculations require distinct highs and lows over fixed periods, a market that is consolidating tightly will cause the components to flatten out and overlap repeatedly. Managing these limitations requires an active risk protocol and a clear understanding of when to bench the system.
What are the limitations of the Ichimoku indicator?
The primary limitation of the Ichimoku system is its vulnerability to ranging or sideways markets.
- False Crossovers: In a flat market, the Tenkan-sen and Kijun-sen will cross each other repeatedly, generating numerous false momentum signals.
- Cloud Whiplash: Price will slice back and forth through a flat, compressed Kumo Cloud, triggering multiple breakout failures.
- Lag in V-Shaped Reversals: Because the system incorporates 26 and 52 periods of data, it can be slow to adapt during sudden, news-driven V-shaped market turnarounds.
Acknowledging these structural blind spots allows us to deploy defensive risk measures to mitigate their impact.
How to manage risk when using Ichimoku?
To neutralize the risks associated with indicator lag and false breakouts, enforce a rigid risk management protocol:
- Apply Capital Constraints: Limit your absolute financial exposure to 1% to 2% of your total account equity per individual trade setup.
- Combine with Price Action: Use candlestick confirmation patterns (like Pin Bars or Engulfing candles) at the Kumo boundary to filter out weak breakouts.
- Leverage Institutional Infrastructure: Utilizing the advanced charting, real-time data feeds, and educational resources found in the XM Guide helps you ensure that your Ichimoku parameters are perfectly calibrated to current global liquidity states, keeping you on the right side of the ledger.
The Ichimoku Indicator stands as an elite technical system that provides unmatched clarity regarding trend direction, support density, and momentum velocity. By remaining disciplined, waiting for complete five-point structural alignments, and keeping a protective shield over your capital during flat market regimes, you can turn this classical tool into a powerful, scalable trading edge.

Thoren Vextal is a specialist in XM trading guides, offering practical insights and real-market experience to help traders improve their strategies and trading performance. Email: [email protected]