
 Tiếng Việt
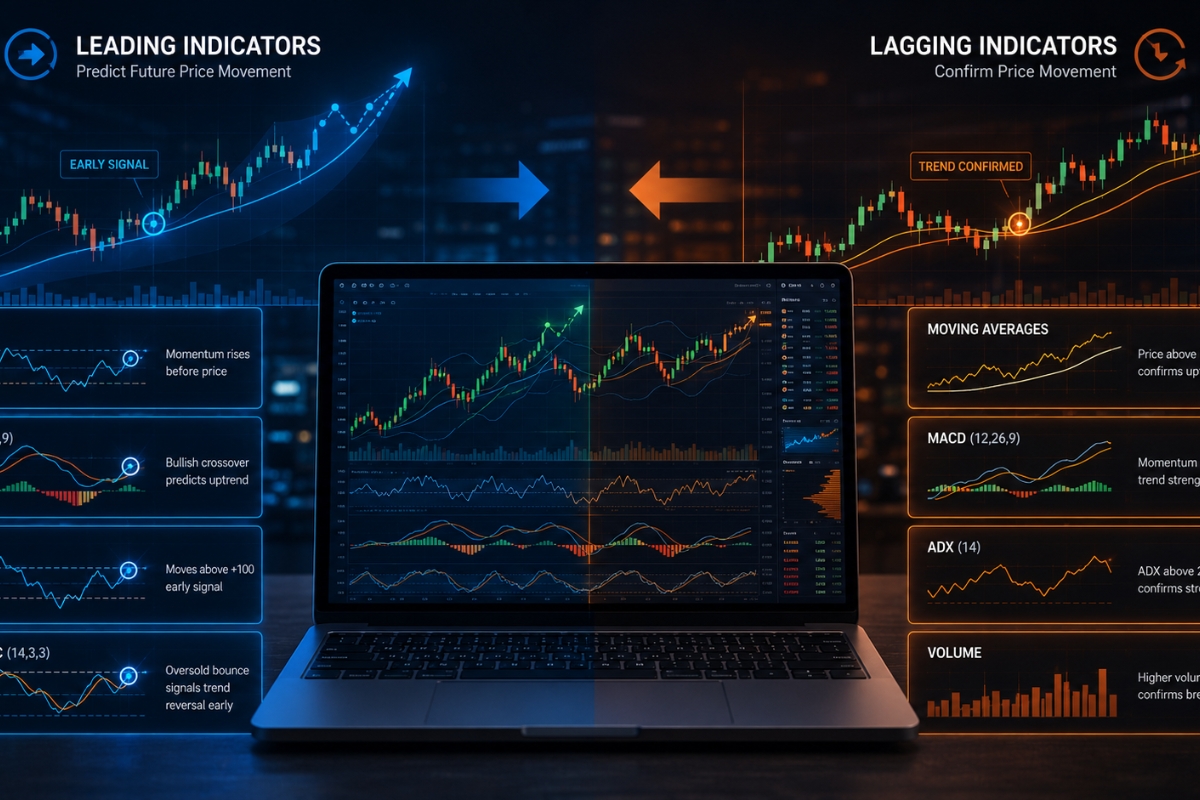
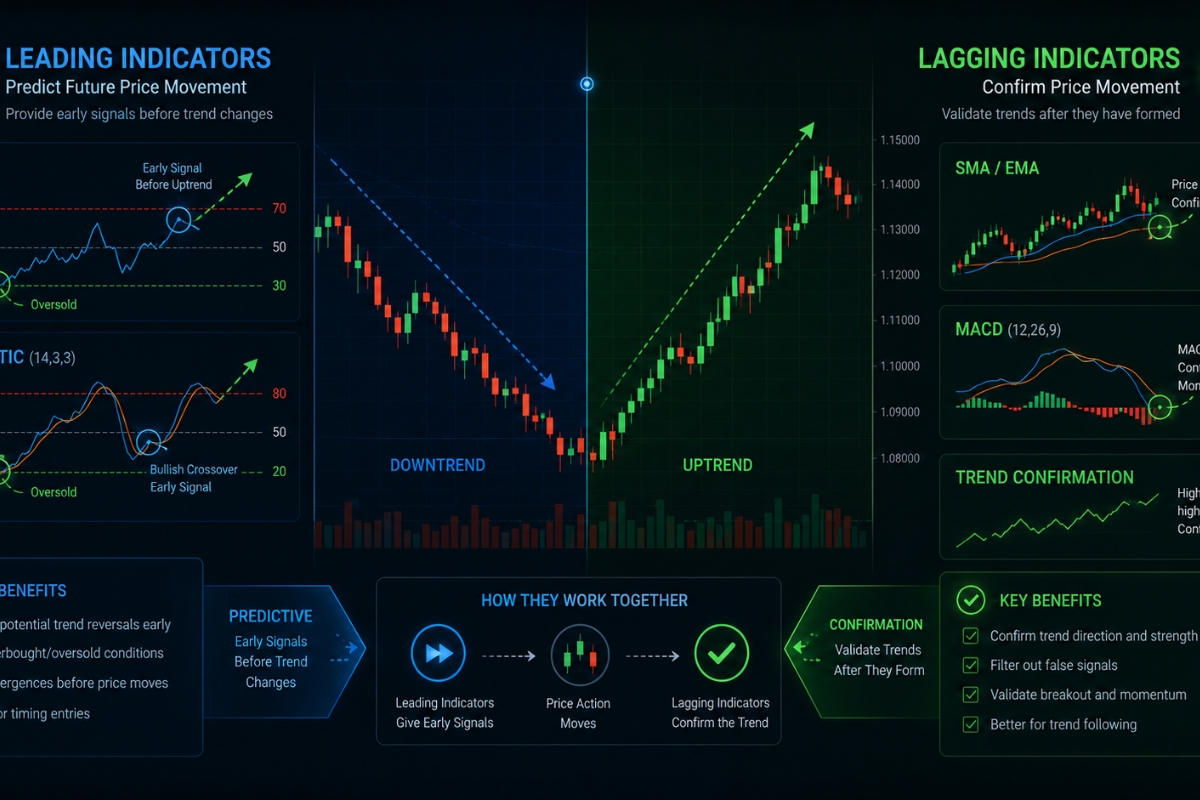
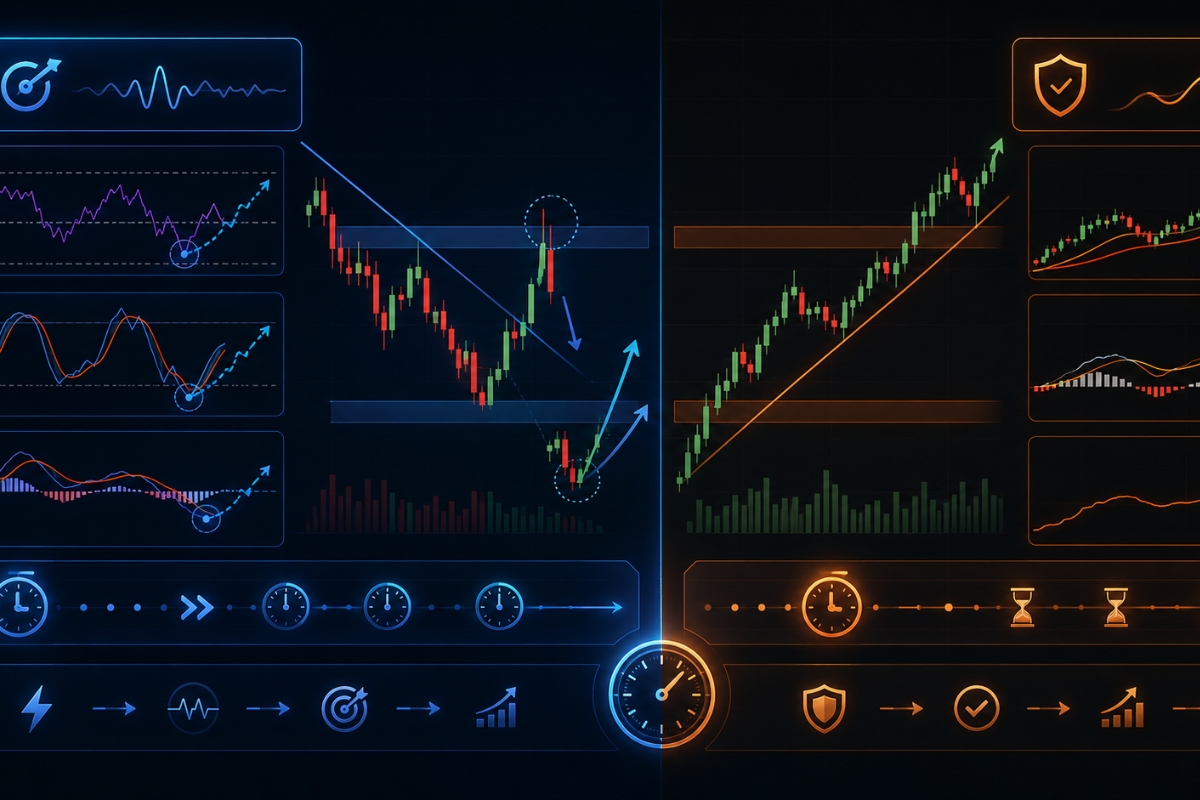
The key difference lies in timing, where leading indicators act before price changes and lagging indicators react after trends are established, affecting how signals are used in trading decisions.
Leading indicators provide early entry signals, whereas lagging indicators offer confirmation signals, allowing traders to balance risk and accuracy in their strategies.
Therefore, combining leading and lagging indicators improves trading accuracy and reduces false signals, especially when aligning entry timing with trend confirmation.
Additionally, leading and lagging indicators are widely used across forex, stocks, and crypto markets, though their effectiveness depends on volatility and market conditions.
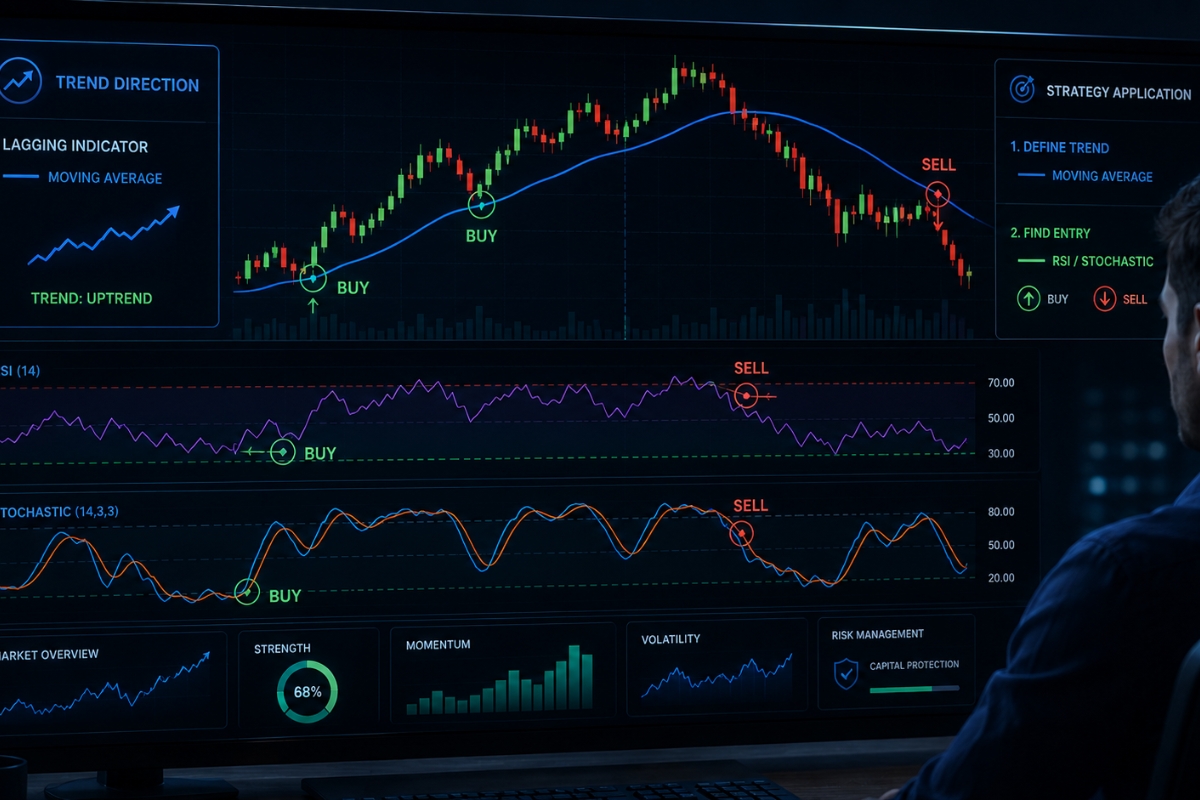
In technical analysis, understanding leading vs lagging indicators is a key factor that helps traders determine entry timing and confirm market trends.
What are leading and lagging indicators in trading?
Leading and lagging indicators in trading are mathematical calculations based on an asset’s price, volume, or open interest used to map out current market environments and forecast future movements.
Leading indicators are predictive metrics that attempt to anticipate price direction before a new trend begins, whereas lagging indicators are trend-following tools that offer confirmation by analyzing past price actions. Statistically, over 85% of institutional trading algorithms utilize a combination of both types to filter out random market noise and identify high-probability reversal points.
What is a leading indicator in financial markets?
A leading indicator in financial markets is a momentum-based tool designed to measure the current velocity of price action to identify overextended conditions before the market actually reverses. These tools are structurally designed to oscillate between fixed boundaries—typically 0 to 100—defining specific zones known as “overbought” and “oversold.” Examples include the Relative Strength Index (RSI) and the Stochastic Oscillator, which provide early warning signs that a trend is losing its underlying power.
While these predictive tools look forward, their counterpart relies strictly on the verification of established history.
What is a lagging indicator in trading?
A lagging indicator in trading is a trend-following metric that provides confirmation signals after a structural price movement has already commenced. These tools smooth out volatile, short-term price fluctuations by averaging historical data over a specified number of candles, such as a 50-period or 200-period moving average. Classic examples include Simple Moving Averages (SMA), Exponential Moving Averages (EMA), and the Moving Average Convergence Divergence (MACD), which keep traders aligned with the dominant macro-trend.
Once you can identify both categories on a chart, the next step is analyzing how they perform against each other in real-time execution.
Key differences between leading and lagging indicators
The fundamental differences between leading and lagging indicators lie in their core mathematical design, operational objectives, and execution timing.
Leading indicators operate with a predictive objective, delivering early signals at the expense of a higher frequency of false breakouts, while lagging indicators prioritize structural confirmation, offering highly accurate signals at the expense of delayed entry points. Striking the perfect balance between these two attributes is the ultimate goal of professional technical analysis.
How do leading and lagging indicators differ in timing?
The variance in timing between these two indicator families can be mathematically mapped using their structural response to price pivots:
- Leading Indicators: These metrics generate signals prior to the initiation of a new trend or during the final stages of trend exhaustion, giving the trader an immediate entry edge.
- Lagging Indicators: These metrics generate signals following a confirmed trend reversal, usually after price has already broken a critical structural level, ensuring the trader enters a validated trend.
| Dimension | Leading Indicators | Lagging Indicators |
| Signal Timing | Generates signals before price pivots | Generates signals after price establishes a trend |
| Market Condition | Optimally used in ranging/sideways markets | Optimally used in trending/directional markets |
| Primary Risk | False signals (“False Breakouts”) | Delayed entries (“Missed Profits”) |
This stark contrast in timing brings up a vital debate among retail traders regarding structural precision.
Which type of indicator is more accurate in trading?
Accuracy in trading is not absolute; it is highly dependent on the current state of the market regime.
In a ranging or consolidating market, leading indicators display an accuracy rate exceeding 70% because they accurately pinpoint clear support and resistance floors. However, in a strong trending market, leading indicators suffer dramatically by giving premature reversal signals, while lagging indicators achieve superior reliability by keeping traders firmly positioned with the institutional flow.
Understanding these operational behaviors allows us to properly dissect the specific signals each tool generates.
Trading signals from leading and lagging indicators
Trading signals from leading and lagging indicators serve distinct strategic purposes, providing either immediate warning signs of a market turn or definitive verification that a trend is stable.
Leading indicators communicate changes in momentum through spatial boundaries and divergence patterns, while lagging indicators communicate structural transitions through spatial crossovers and trendline geometry. Professionals utilize these distinct signal sets to construct a comprehensive layout of the market’s internal mechanics.
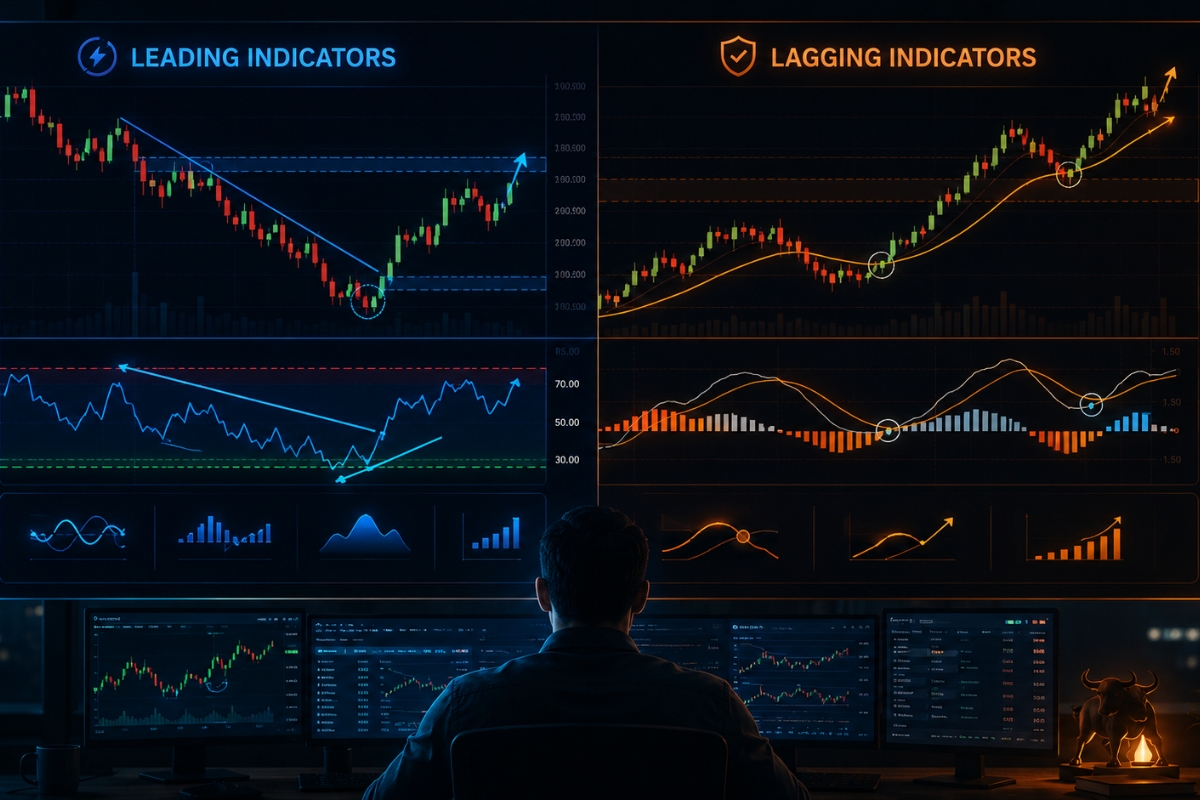
What signals do leading indicators provide?
Leading indicators generate high-velocity signals that focus on momentum shifts and structural exhaustion points:
- Overbought/Oversold Readings: An RSI reading above 70 signals the market may be overextended to the upside, while a reading below 30 indicates a heavily discounted floor.
- Momentum Divergences: When price creates a higher high but the oscillator creates a lower high, it signals that the underlying buying pressure is drying up.
- Centerline Crossovers: An oscillator crossing its 50-midline confirms that short-term momentum is shifting in favor of the breakout direction.
While these signals keep you ahead of the curve, lagging indicators ensure you aren’t stepping in front of a runaway freight train.
What signals do lagging indicators provide?
Lagging indicators deliver structural signals that focus on trend validation and long-term momentum sustainability:
- Moving Average Crossovers: A short-term average crossing above a long-term average (such as the famous Golden Cross where the 50 SMA crosses above the 200 SMA) confirms a powerful macro bull run.
- Price-Line Relationships: When price maintains a structural position above a rising 200-period EMA, it acts as a continuous trend-following buy signal.
- MACD Histogram Shifts: The transition of the MACD histogram from negative to positive territory confirms that the medium-term trend velocity has officially flipped bullish.
Once you have mastered both sets of independent signals, you can confidently transition to the advanced phase of strategy synthesis.
Application of leading and lagging indicators in trading strategies
The application of leading and lagging indicators within an institutional trading strategy focuses on creating a dual-layered filter that combines predictive entries with trend-following safety nets.
By leveraging the forward-looking nature of leading tools alongside the retrospective verification of lagging metrics, traders can build a system with a highly optimized win rate. This synthesis eliminates the vulnerability of relying on a single data source, ensuring your strategy adapts across various market regimes.
How to combine leading and lagging indicators effectively?
To combine these tools effectively, you must assign them distinct structural roles within your trading plan:
- The Lagging Filter (The Trend Identifier): Use a lagging indicator like a 50 EMA to establish the overall market direction. If the price is above the EMA, your bias is strictly bullish.
- The Leading Trigger (The Entry Optimizer): Once the trend direction is locked in, use a leading indicator like the Stochastic Oscillator to wait for a temporary retracement into an “oversold” zone to execute your entry.
This structured sequence, championed by platforms like XM Guide, ensures you trade in harmony with the macro trend while buying at an optimal wholesale price.
To make this functional, active traders deploy specific technical combinations that complement each other’s mathematical formulas.
What are common indicator combinations in trading?
The most reliable and historically verified indicator combinations include:
- RSI + Moving Average Crossover: The 50/200 SMA crossover defines the primary trend, while the RSI filters entries by triggering only when a pullback occurs.
- Stochastics + MACD: The MACD line crossover establishes a medium-term trend shift, while the Stochastic lines provide precise, localized entry triggers at key support zones.
- Bollinger Bands + RSI: The Bollinger Bands (a volatility-based lagging channel) define price extremes, while the RSI confirms if those extremes are backed by true momentum exhaustion.
With these strategy combinations formulated, we must analyze how their performance alters across different financial market landscapes.
Applying indicators in forex, stocks and crypto markets
Applying Leading vs Lagging Indicators across diverse asset classes requires a careful calibration of settings to account for unique liquidity profiles, trading hours, and systematic volatility.
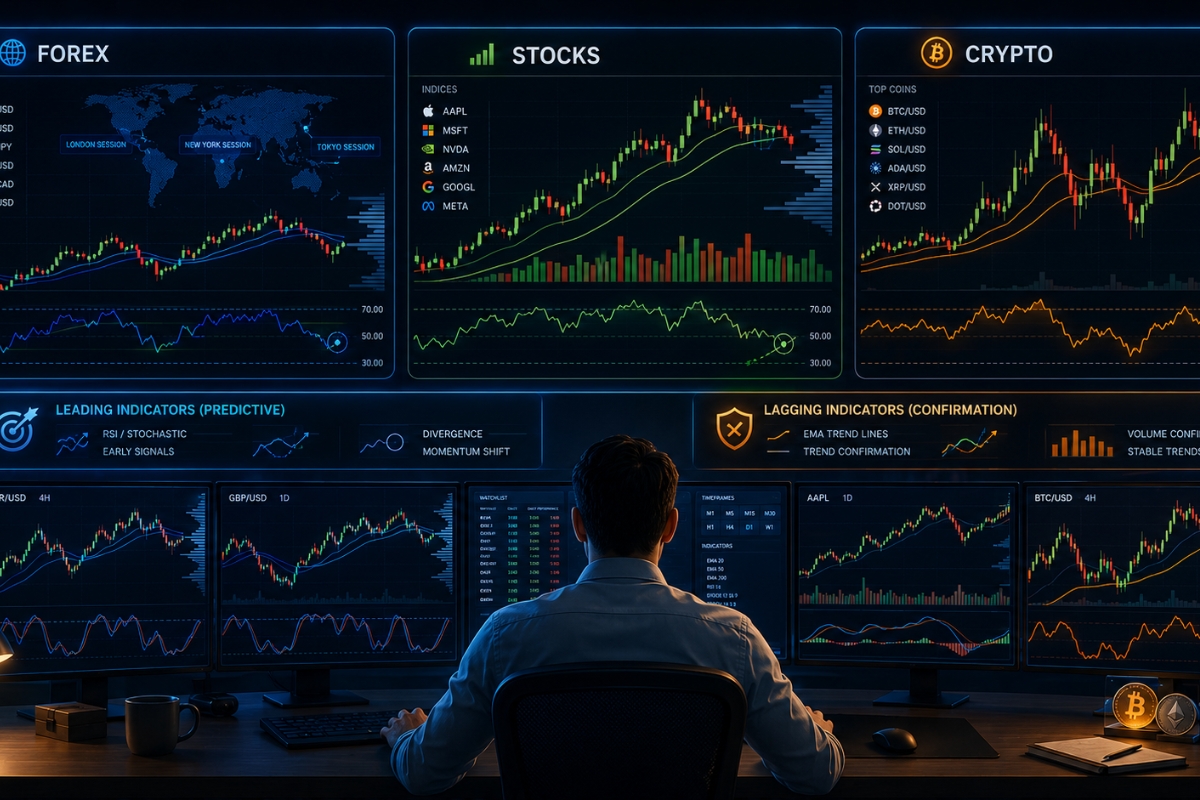
While the core mathematical formulas of these tools remain completely identical, their structural behavior can shift dramatically when transitioning from a highly liquid, 24/5 macroeconomic market like Forex to a highly volatile, sentiment-driven market like Cryptocurrency.
How to use indicators in forex and stock trading?
In Forex Trading, due to its massive daily liquidity exceeding $7 trillion, lagging indicators like the 50 EMA provide exceptionally stable trend baselines, while leading indicators are ideal for capturing session-specific ranges (e.g., London breakout pullbacks). In Stock Trading, indicators must be paired with volume-weighted metrics; a lagging indicator like the 200-day moving average acts as a primary institutional accumulation floor, while leading indicators are best used to trade momentum cycles following quarterly corporate earnings announcements.
While traditional assets follow clear, cyclical frameworks, the digital asset frontier introduces an entirely different layer of volatility.
Are leading and lagging indicators effective in crypto trading?
Indicators are highly effective in cryptocurrency trading, but they require a strict adaptation to survive the asset class’s extreme liquidity sweeps and 24/7 continuous trading cycle. Because crypto markets are heavily driven by retail sentiment and sudden liquidations, leading indicators on lower timeframes (such as 15-minute or 1-hour charts) frequently generate false oversold signals during intense market flushes. To counter this, professional traders visiting the MBroker homepage prioritize higher timeframes (4-Hour and Daily) and combine their lagging moving averages with volume-profile indicators to ensure their signals are backed by true institutional capital rather than speculative retail noise.
In conclusion, mastering the relationship between leading and lagging indicators is a fundamental requirement for building a scalable, data-driven trading business. By assigning lagging indicators the role of trend confirmation and utilizing leading indicators for tactical, low-risk entries, you eliminate emotional bias from your execution.

Thoren Vextal is a specialist in XM trading guides, offering practical insights and real-market experience to help traders improve their strategies and trading performance. Email: [email protected]