
 Tiếng Việt
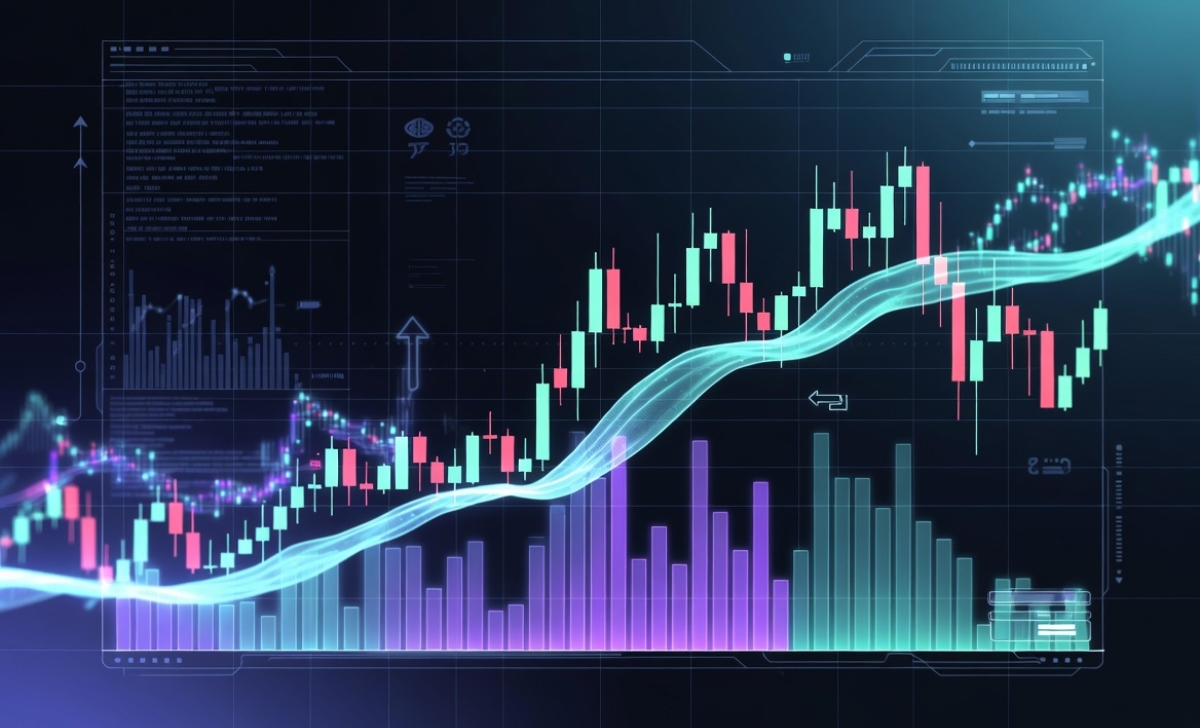
Volume Weighted Average Price (VWAP) is an intraday benchmark that reflects the average traded price weighted by volume, widely used to identify fair value during a trading session.
Moreover, VWAP calculation is based on cumulative price × volume divided by total volume, making it more accurate than simple moving averages for intraday analysis.
In addition, VWAP strategy focuses on trading around the mean—buying below VWAP and selling above VWAP to align with institutional execution behavior.
Furthermore, VWAP acts as dynamic support and resistance, where price reactions around VWAP indicate market structure and short-term trend direction.
Finally, VWAP trading guide highlights its institutional relevance, but also its limitation as an intraday-only indicator that resets daily and is less effective for long-term analysis.
Volume Weighted Average Price (VWAP) is a key intraday indicator that reflects the true average price based on volume, helping traders identify fair value and optimize entries. This guide explains how VWAP works, strategies, and real trading applications. Explore more in Forex Technical Analysis at MBroker to improve your trading edge.
Volume Weighted Average Price (VWAP) in trading
The Volume Weighted Average Price (VWAP) is an intra-day technical benchmark that tracks the true average price of a financial asset throughout a single trading session, based on both transactional volume and price history.
Roughly 70% of institutional trading algorithms utilize this specific metric to benchmark their large order execution performance, making it a critical tool for detecting smart money behavior. By mapping a volume weighted average price chart on your terminal, you can easily determine whether an asset is currently trading at a premium or a discount relative to the true session average.
What is Volume Weighted Average Price (VWAP)?
What is volume weighted average price? In technical analysis, the volume weighted average price indicator is a trailing, volume-weighted calculation that resets at the open of every single new intraday trading session. Unlike a standard price line, it combines transactional volume data with price movement to identify the exact fair value equilibrium of an asset at any given minute of the day. This unified calculation allows retail day traders to immediately identify if a market trend is backed by heavy institutional buying or simple retail speculation.
Understanding this clear definition helps highlight why macro fund managers place such an intense emphasis on this tool.
Why is VWAP important in financial markets?
Understanding what is volume weighted average price and monitoring its trajectory is critically important because it serves as the ultimate reference point for institutional liquidity. Large mutual funds and pension funds do not buy assets blindly; they are legally or structurally required to execute multi-million dollar orders as close to the daily session average price as possible. Consequently, when price deviates too far from the central line, it triggers immediate buying or selling reactions from major market makers, providing retail day traders with highly predictable, high-probability trade setups.
To successfully capture these high-probability opportunities, you must master the mathematical calculations that construct this indicator.
How VWAP works and calculation method?
The volume weighted average price calculates the total dollar volume traded in an asset divided by the total accumulated number of shares or contracts traded over a single session.

This rolling calculation updates continuously with every new intraday candle, starting fresh at 00:00 server time and expanding its cumulative dataset throughout the trading day. This constant mathematical recalculation ensures that high-volume trading hours (such as market opens) carry significantly more weight on the indicator line than low-volume mid-day consolidation periods.
What is the VWAP formula?
To understand how to find volume weighted average price mathematically, we examine the cumulative structural equation used by modern charting engines:
VWAP = (Sum of (Typical Price × Volume)) / (Total Volume)
Where the components are defined as:
- Typical Price = (High + Low + Close) / 3
- Sum of (Typical Price × Volume) = The cumulative total of the typical price multiplied by the corresponding volume of each candle
- Total Volume = The cumulative trading volume accumulated since the beginning of the session
While this equation looks similar to standard technical lines, its inclusion of volume changes its charting behavior completely.
How does VWAP differ from moving averages?
The core difference between the vwap indicator and standard moving averages (like the SMA or EMA) lies in its weight distribution and session reset parameters:
- Moving Averages: Look backward over a fixed number of candles (e.g., a 20 EMA) and treat all candles equally, completely ignoring transactional volume changes.
- The VWAP Line: Includes real-time volume, causing the line to remain highly stubborn during heavy institutional blocks and move smoothly during low-volume periods. Furthermore, it completely resets its data to zero at the start of every new day, whereas moving averages carry lagging data across multiple weeks.
Once you comprehend these structural differences, you can begin deploying the indicator within a live intraday workflow.
VWAP strategy in intraday trading
A professional vwap strategy utilizes the indicator line as a definitive baseline to identify immediate trend direction, execute intraday pullbacks, and manage risk parameters.
When price maintains a structural position cleanly above the indicator line, the intraday market is considered structurally bullish, whereas trading below the line validates a dominant bearish environment. By aligning your execution with this daily threshold, you eliminate the dangerous retail habit of buying overextended tops or shorting stable market bottoms.
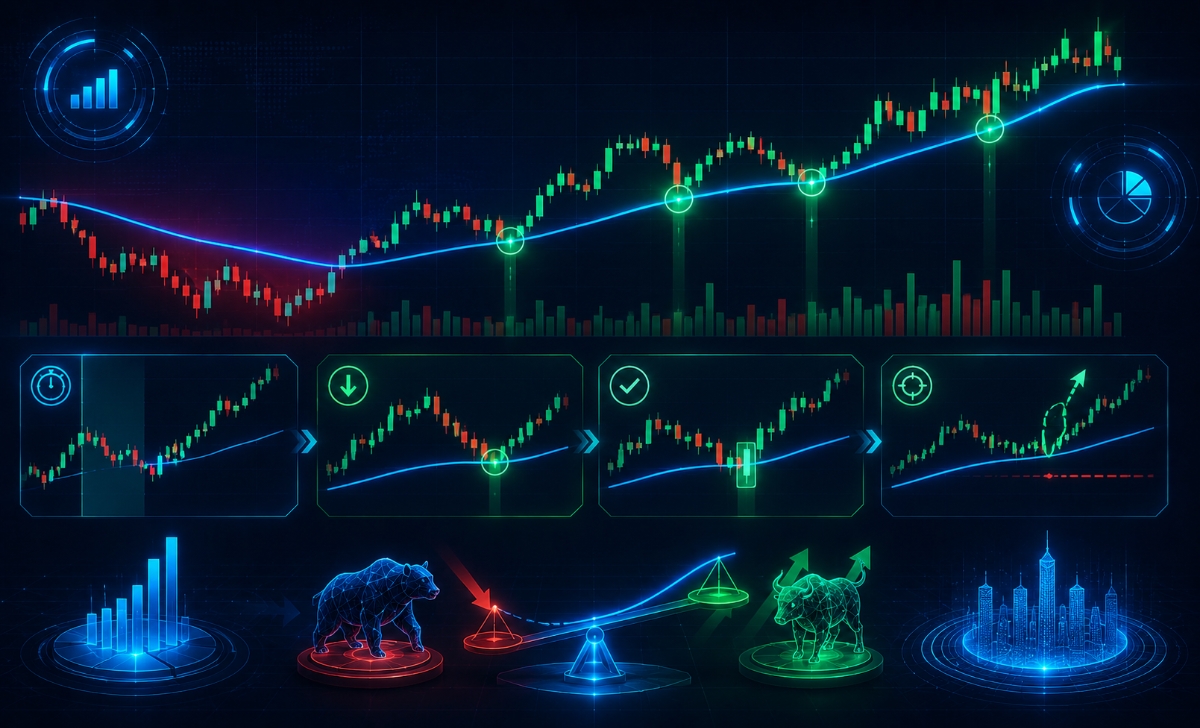
How to trade using VWAP strategy?
To execute a rule-based vwap trading strategy with absolute precision, follow this definitive 4-step framework:
- Identify the Opening Drive: Wait for the first 30 minutes of the trading session to pass, allowing institutional volume to establish a clear direction relative to the indicator line.
- Wait for the Structural Pullback: If price is trading above the line, wait for a minor downward corrective pullback to return exactly to the vwap line.
- Confirm Entry Signal: Look for a bullish price action confirmation candle (such as a pin bar or engulfing pattern) to print directly on top of the indicator support line.
- Place Risk Parameters: Execute your long position immediately, placing your protective stop-loss 2 pips below the indicator line and targeting the recent session high.
Modifying this strategy for maximum efficiency requires selecting the exact market environments where the indicator carries the most predictive weight.
When is VWAP most effective in trading?
A volume weighted average price trading strategy is exceptionally effective during strong, high-volume intraday trending days where major commercial institutional players are actively driving price in a single direction. During these specific high-momentum sessions, the indicator serves as an unbreakable dynamic moving boundary, allowing trend-following traders to repeatedly buy the dip or short the rally with minimal drawdown. Conversely, the tool loses structural effectiveness on high-order timeframes like daily or weekly charts, as it is custom-engineered purely for intraday analysis.
To expand its utility, professional day traders also use the line to map out critical intraday horizontal support and resistance boundaries.
VWAP as support and resistance in market structure
The volume weighted average price acts as a highly powerful dynamic support and resistance boundary within the intraday market structure because it represents the definitive collective entry price of the world’s largest financial institutions.
Statistically, when price approaches the indicator line from above, institutional algorithms view the asset as being at a fair, non-premium price and actively inject fresh buy orders to defend their average positions. This concentration of institutional resting order blocks transforms a simple technical line into a formidable physical structural floor on your intraday charts.
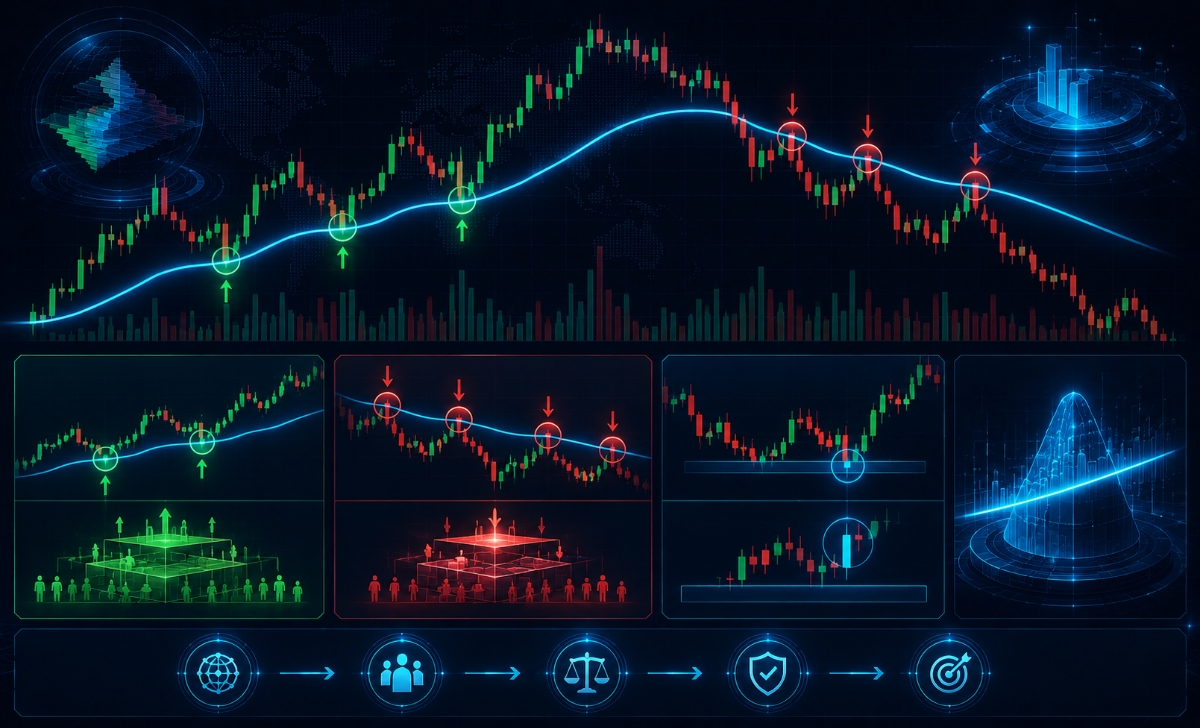
How does VWAP act as support and resistance?
The indicator acts as support or resistance through a self-fulfilling loop driven by institutional order flow parameters:
- Dynamic Intraday Support: In a macro uptrend, price frequently pulls back to the line, where automated institutional algorithms buy the discount, creating a structural support bounce.
- Dynamic Intraday Resistance: In a dominant downtrend, the line serves as a powerful ceiling; every touch of the line triggers fresh institutional short-selling liquidity, rejecting price back downward.
To filter out minor fakeouts around this boundary line, you must cross-reference your indicators with localized price action structures.
How to combine VWAP with price action?
To optimize your vwap trading accuracy, you must always look for confluence between the indicator line and raw price action structures:
- Horizontal Confluence: Only take a buy bounce off the line if it occurs at an established horizontal support zone or previous session swing high.
- Candlestick Validation: Ensure that any touch of the line is accompanied by a dramatic shrinkage in candle bodies followed by a strong rejection wick, confirming that institutional limit orders are actively absorbing the selling pressure.
By combining these visual filters, you can safely transition into advanced, institutional-grade strategic market modeling.
Advanced VWAP usage and institutional trading perspective
From an advanced institutional perspective, the volume weighted average price is not used merely as a simple entry trigger, but rather as an absolute metric to grade execution efficiency and deploy massive algorithmic blocks without disrupting market equilibrium.
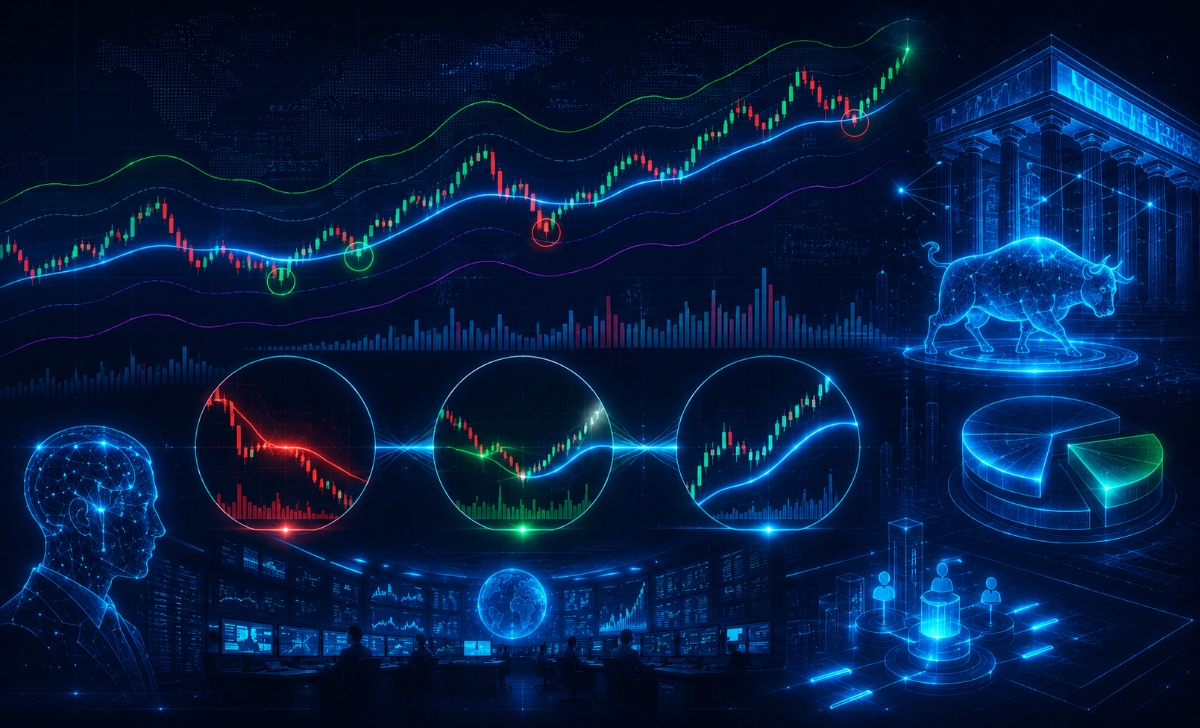
Commercial market makers utilize multi-band expansions of the indicator to map out standard deviations of value, creating comprehensive volatility envelopes. Understanding this high-level operational perspective allows retail traders to step away from amateur retail pitfalls and trade alongside smart money networks.
How do institutional traders use VWAP?
Institutional bank desks and algorithmic funds utilize the indicator to execute massive multi-million dollar portfolios through targeted execution protocols:
- Passive Accumulation: If an institution wants to buy a large block of an asset, they set their algorithms to buy exclusively when price trades below the line, ensuring they capture a net-discount price.
- Performance Benchmarking: Portfolio managers are graded at the end of the day based on whether their final fill price beats or matches the daily indicator line.
- Algorithmic Routing: If an algorithm executes a large order above the line during an uptrend, it is flagged as an inefficient, premium execution, prompting automated pauses.
By understanding these institutional routing guidelines through the expert technical resources published on the MBroker, retail day traders can easily position their orders exactly alongside big bank liquidity flows.
What are the limitations of VWAP indicator?
Despite its massive structural strengths, the indicator carries distinct operational limitations that you must carefully manage:
- Intraday Lag: As the trading day progresses toward the New York afternoon close, the cumulative volume dataset becomes massive, causing the indicator line to become increasingly heavy and slow to react to late-day price spikes.
- Trend-Free Whipsaws: During completely flat, sideways range-bound market environments, prices will repeatedly cross back and forth across the line, generating false breakout signals.
- Intraday Restriction: It cannot provide long-term swing trading context on daily, weekly, or monthly charts, requiring you to combine it with macro structural tools.
In short, the Volume Weighted Average Price indicator is an indispensable tool for identifying true market equilibrium, tracking institutional order routing, and executing highly precise intraday setups. By focusing your entries on session pullbacks, using the line as dynamic support/resistance, and filtering signals through clean price action, you can easily minimize your transaction costs.

Thoren Vextal is a specialist in XM trading guides, offering practical insights and real-market experience to help traders improve their strategies and trading performance. Email: [email protected]