
 Tiếng Việt

Renko Charts are price-based charts that filter market noise by forming bricks only when price moves a fixed amount, helping traders focus on clear trends instead of time-based fluctuations.
Moreover, Renko charts simplify price action analysis by highlighting trends and eliminating minor price movements, making it easier to identify support, resistance, and momentum shifts.
Therefore, Renko charts are commonly used in trend-following strategies, where traders enter positions based on brick direction changes and confirmed breakouts.
Additionally, Renko charts can be installed on MT4/MT5 using custom indicators, allowing traders to configure brick size and apply the method directly on popular trading platforms.
As a result, Renko charts are effective in trading forex, crypto, and stocks, especially for traders who prefer clean signals and reduced market noise.
Learn how Renko charts work in trading, how to read price movements, set them up on MT4/MT5, and apply Renko trading strategies in forex, cryptocurrencies, and stocks—all covered in the Forex Technical Analysis section.
Renko charts in trading and how they work?
Renko Charts are price-based trading charts that filter out minor market noise and focus only on meaningful price movement. Unlike time-based charts, Renko Charts form a new “brick” only when price moves by a fixed amount, such as 10 pips, 50 points, or 1% of price value.
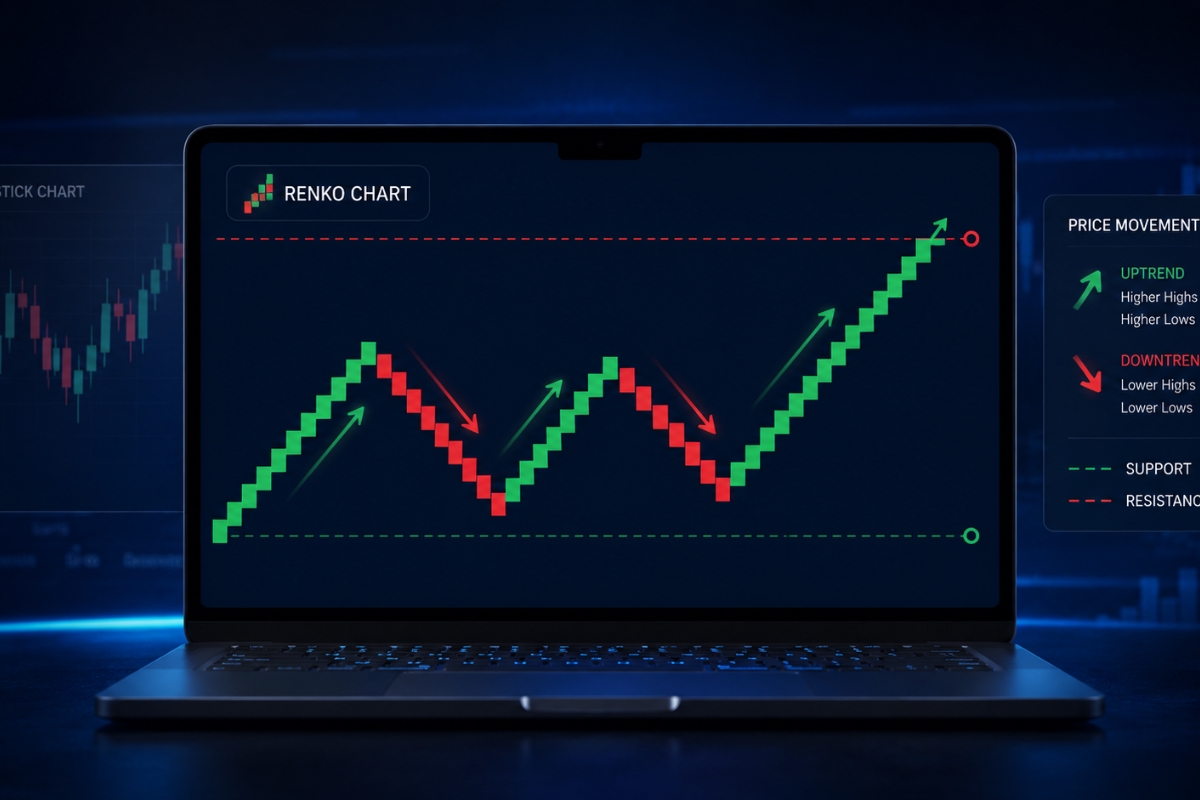
This makes them useful for traders who want clearer trend direction, cleaner support and resistance zones, and more disciplined trade execution. To understand their value, it is important to first know how Renko bricks are created.
What are Renko charts and how are bricks formed?
Renko Charts are a Japanese charting method designed to show price movement without the distraction of time. The word “Renko” comes from “renga,” meaning brick. Each brick represents a fixed price movement, and bricks are plotted diagonally either upward or downward.
For example, if a trader sets the Renko brick size to 10 pips on EUR/USD, a new bullish brick appears only when price rises 10 pips from the previous brick. A bearish brick appears only when price falls enough to reverse by the required amount. This removes small fluctuations that often create confusion on standard charts.
Renko bricks can be based on:
- Fixed pip or point size, such as 10 pips in forex or 100 points in indices.
- ATR-based size, where the brick size adjusts according to market volatility.
- Percentage movement, often used in stocks or crypto markets.
This structure helps traders see whether buyers or sellers are controlling the market. However, because Renko Charts ignore time, they look very different from traditional candlestick charts, which leads to the next important point.
Why do Renko charts differ from candlestick charts?
Renko Charts differ from candlestick charts because they are based on price movement rather than time intervals. A candlestick chart creates a candle every minute, hour, or day, regardless of whether price moves significantly. In contrast, a Renko chart may create several bricks during a fast market or no bricks at all during a quiet session.
This difference creates several trading advantages:
- Less market noise: Small price movements are filtered out.
- Clearer trends: Consecutive bricks in one direction show strong momentum.
- Simpler visual analysis: Traders can identify reversals more easily.
- Reduced emotional trading: The chart removes many false intraday fluctuations.
However, Renko Charts also have limitations. Since they do not show time in the same way as candlesticks, traders may miss certain intraday details such as exact volatility spikes or news-driven price reactions. Therefore, Renko Charts are best used as part of a complete trading plan rather than as a standalone decision tool. With this foundation clear, the next step is to understand how traders interpret price action using Renko Charts.
Price action interpretation using Renko charts
Price action on Renko Charts is easier to read because the chart highlights directional movement and filters out weak price changes. Traders use Renko bricks to identify trends, reversals, breakouts, and key price zones. Since every brick represents a confirmed price move, Renko Charts can support more objective decision-making. The most basic use begins with trend identification.

How to identify trends using Renko charts?
Trends on Renko Charts are identified by the direction and sequence of bricks. When multiple bullish bricks form consecutively, the market is moving upward. When multiple bearish bricks appear, the market moves downward. This makes trend detection more straightforward than on candlestick charts, where wicks and mixed candles can create uncertainty.
A simple trend-reading method includes:
- Bullish trend: A series of green or upward bricks.
- Bearish trend: A series of red or downward bricks.
- Trend weakness: Smaller movement, alternating bricks, or failed continuation.
- Potential reversal: A brick forms in the opposite direction after a sustained move.
For example, if GBP/USD prints eight bullish Renko bricks with a 10-pip brick size, it indicates approximately 80 pips of directional upward movement. This does not guarantee the trend will continue, but it shows that buyers have controlled prices over a meaningful range.
Professional traders often combine Renko trend direction with higher time frame analysis. If the daily market structure is bullish and Renko Charts show continued upward bricks, the probability of a trend-following setup may improve. After identifying directions, traders usually look for important price levels.
How to spot support and resistance on Renko charts?
Support and resistance on Renko Charts are spotted by identifying repeated brick reversals near the same price area. Because Renko Charts reduce noise, these zones can appear cleaner than on candlestick charts. Support forms where bearish bricks stop and bullish bricks begin. Resistance forms where bullish bricks stop and bearish bricks appear.
Traders can mark support and resistance using:
- Previous swing highs and swing lows.
- Areas where multiple brick reversals occurred.
- Breakout levels where price moved strongly after consolidation.
- Psychological levels such as 1.1000 in forex or $50,000 in crypto.
For example, if EUR/USD repeatedly reverses near 1.0850 on a Renko chart, that level may act as support. If price breaks below it and prints several bearish bricks, the same level may become resistant.
Renko support and resistance are especially useful for breakout traders because a confirmed brick beyond a key level can signal stronger directional commitment. Still, accurate chart setup is essential, so traders must understand how to configure Renko Charts on popular platforms like MT4 and MT5.
Renko charts setup on MT4 and MT5 platforms
Renko Charts are not always included as a default chart type on MetaTrader platforms, especially on MT4.
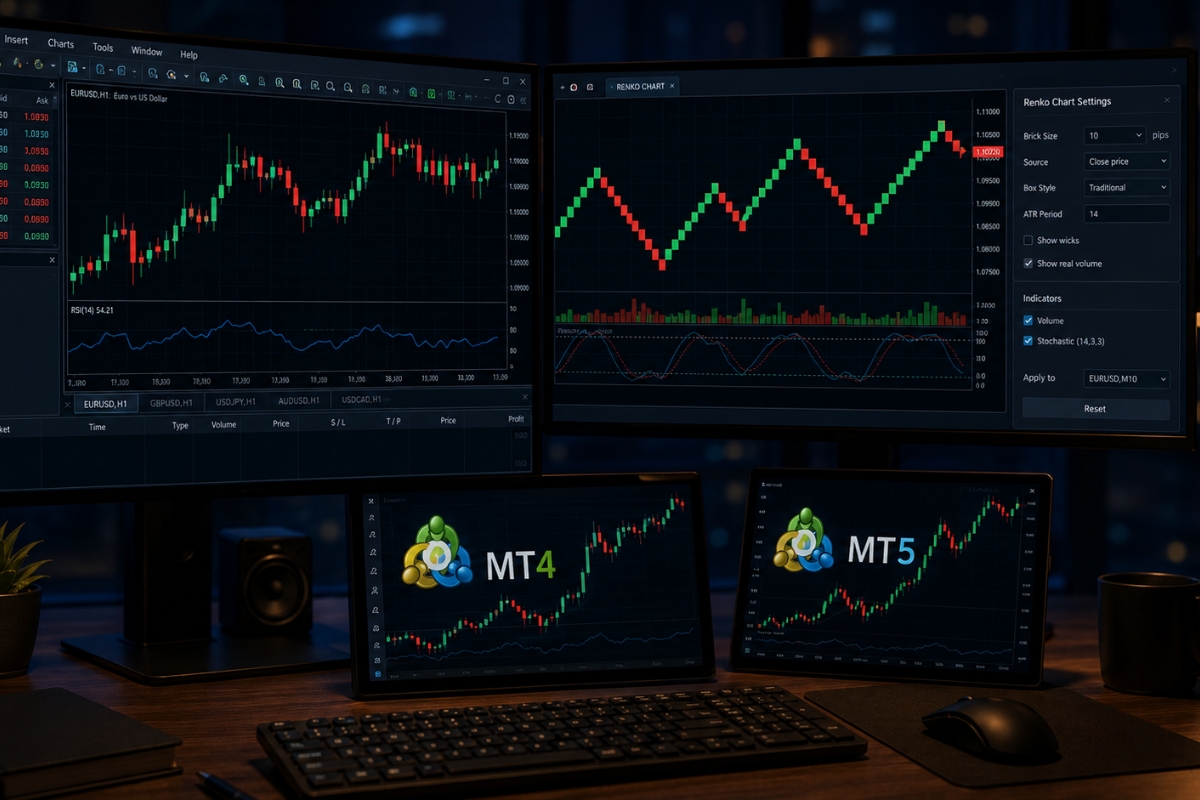
Traders often need to install a Renko indicator, expert advisor, or custom script to generate offline Renko charts. On MT5, setup may be more flexible depending on the broker and available tools. A correct setup matters because poor brick sizing can lead to misleading signals.
How to install Renko charts on MT4 step by step?
To install Renko Charts on MT4, traders usually need a Renko generator indicator or expert advisor. The process may vary slightly, but the general steps are similar across most MT4 installations.
Basic MT4 Renko setup:
- Download a Renko indicator or EA from a reliable source.
- Open MT4 and click File > Open Data Folder.
- Go to MQL4 > Indicators or MQL4 > Experts, depending on the file type.
- Paste the Renko file into the correct folder. Restart MT4.
- Attach the Renko tool to a standard chart, such as EUR/USD M1.
- Set the brick size, for example, 10 pips.
- Open the generated offline chart if required.
The most important setting is brick size. A small brick size, such as 5 pips, creates more signals but also more false moves. A larger brick size, such as 20 or 50 pips, filters more noise but may generate later entries.
For traders using an educational or brokerage-related platform such as MBroker, Renko Charts can be introduced as part of a broader technical analysis toolkit. The key is not only installing the chart but also learning how brick size, volatility, and market conditions affect trading decisions. Once MT4 is clear, MT5 configuration is the next logical step.
How to configure Renko charts on MT5 effectively?
MT5 supports more advanced market data handling than MT4, but Renko Charts may still require custom indicators or tools depending on the broker. Traders can configure Renko Charts on MT5 by installing a compatible indicator from the Market, Code Base, or a trusted provider.
Effective MT5 Renko configuration should include:
- Brick size selection: Match the asset’s volatility.
- ATR option: Use average true range to adjust dynamically.
- Wick display: Enable wicks if you want to see intrabrick extremes.
- Session filtering: Avoid low-liquidity trading periods.
- Backtesting compatibility: Check whether the Renko tool works in the strategy tester.
A good rule is to test several brick sizes before trading live. If the chart shows too many alternating bricks, the size may be too small. If signals appear very late, the size may be too large. After the chart is configured properly, traders can focus on building a Renko trading strategy.
Renko charts trading strategy and execution
A Renko Charts trading strategy should define trend direction, entry rules, stop-loss placement, and exit conditions before any position is opened. Because Renko Charts simplify price movement, they can help traders avoid overtrading.

However, clear rules are still required to manage risk and avoid false reversals. A simple trend-following strategy is often the best starting point.
What is a simple Renko trading strategy?
A simple Renko trading strategy is to trade in the direction of the trend after a confirmed reversal or breakout. This approach works best in markets with strong directional movement.
Example Renko trend strategy:
- Use a fixed brick size, such as 10 pips on major forex pairs.
- Wait for at least three bricks in the same direction.
- Enter after a pullback and a new brick in the trendy direction.
- Place the stop-loss below the recent Renko swing low to buy trades.
- Take profit at the next resistance level or after an opposite brick appears.
Risk management is essential. Many professional traders risk only 1% to 2% of account equity per trade. This protects the trading account during losing streaks and allows the strategy to perform over a larger sample of trades. To improve signal quality, many traders combine Renko Charts with indicators.
How to combine Renko charts with indicators for better signals?
Renko Charts can be combined with indicators to filter weak trades and confirm momentum. Since Renko already filters price noise, indicators should be used carefully. Too many indicators can create confusion and reduce the chart’s simplicity.
Common indicator combinations include:
- Moving averages: Identify trend direction. Price above a 50-period moving average may support buy setups.
- RSI: Detect overbought or oversold conditions.
- MACD: Confirm momentum shifts.
- ATR: Help choose an appropriate brick size.
- Bollinger Bands: Identify volatility expansion and breakout conditions.
For example, a trader may only take buy trades when Renko bricks are bullish and price is above the 50-period moving average. If RSI is above 50, it may further confirm bullish momentum.
Still, indicators should support price action, not replace it. The strongest Renko strategies often combine clean chart structure, disciplined execution, and risk control. Once the strategy is defined, traders can consider how Renko Charts perform across different financial markets.
Applying Renko charts in real trading markets
Renko Charts can be applied in forex, crypto, stocks, indices, and commodities. Their effectiveness depends on liquidity, volatility, spread, and trading style. They are particularly useful in trending markets but may produce false signals during choppy or sideways conditions. Forex is one of the most common markets where traders use Renko Charts.
How effective are Renko charts in forex trading?
Renko Charts can be effective in forex trading because currency pairs often move in clear intraday and swing trends. Major pairs such as EUR/USD, GBP/USD, and USD/JPY usually have high liquidity and relatively tight spreads, which makes them suitable for Renko-based strategies.
Benefits of forex include:
- Clear trend visualization.
- Reduced noise during active sessions.
- Better breakout confirmation.
- Easier support and resistance mapping.
However, forex traders must consider spread and execution costs. If a trader uses a 5-pip Renko brick on a pair with a 2-pip spread, transaction cost becomes significant. A larger brick size may be more practical for reducing cost impact.
Renko Charts may also perform better during high-liquidity sessions, such as the London and New York sessions. During low-volume periods, prices can move unpredictably and create misleading reversals. Beyond forex, traders also apply Renko analysis to crypto and stock markets.
Can Renko charts be used for crypto and stocks?
Yes, Renko Charts can be used for crypto and stocks, but traders must adjust the brick size according to volatility. Crypto markets such as Bitcoin and Ethereum can move sharply within minutes, so small brick sizes may create excessive signals. Stocks also vary widely: a large-cap stock may need a different Renko setting than a small-cap growth stock.
For crypto trading, traders often use:
- Percentage-based brick sizes.
- ATR-based bricks.
- Wider stops due to higher volatility.
- Confirmation of volume and trend indicators.
For stock trading, Renko Charts can help identify longer-term trend continuation and breakout zones. Swing traders may use daily or higher-value Renko settings to filter out short-term price noise.
In all markets, Renko Charts are most effective when used with a complete trading framework. Traders should test their settings, track performance, and avoid assuming that one brick size works for every asset. When used correctly, Renko Charts can become a powerful tool for reading price action, building structured strategies, and improving trading discipline across global financial markets.

Thoren Vextal is a specialist in XM trading guides, offering practical insights and real-market experience to help traders improve their strategies and trading performance. Email: [email protected]