
 Tiếng Việt
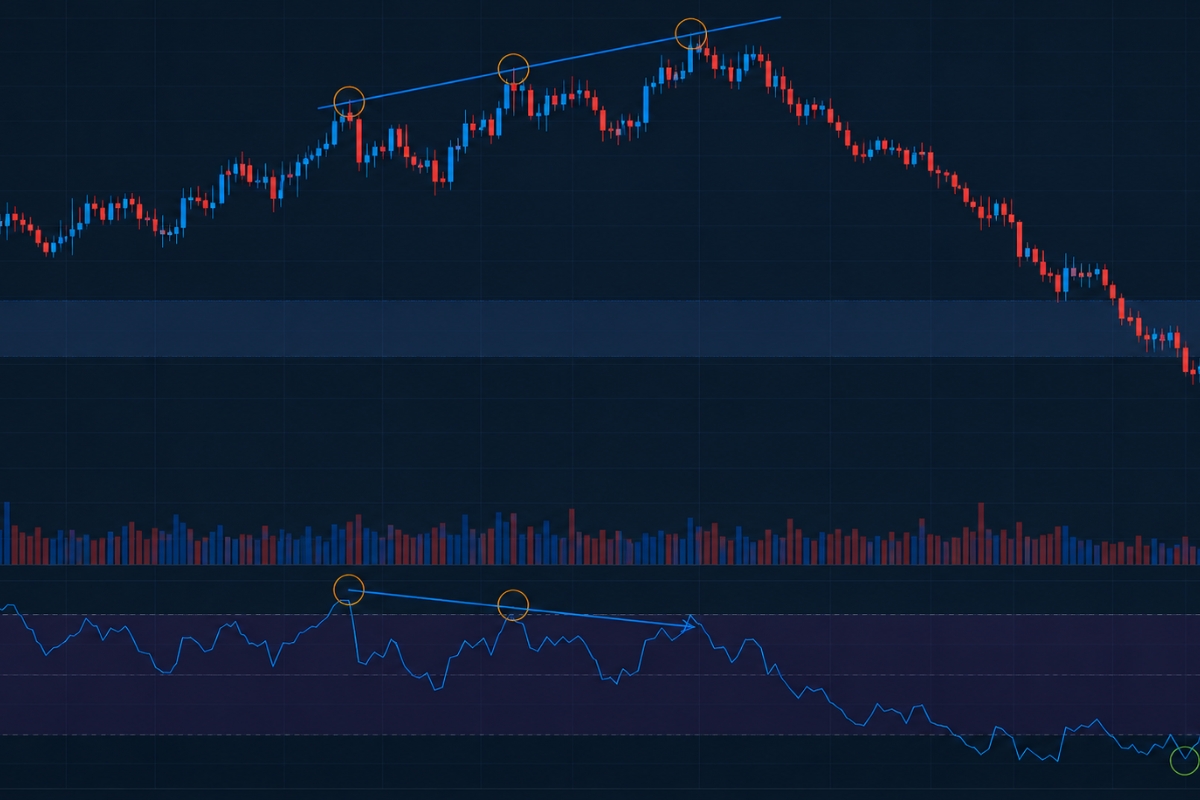
RSI (Relative Strength Index) is a momentum indicator that measures the strength of price movements on a scale from 0 to 100, traders identify overbought and oversold conditions quickly.
Additionally, RSI is calculated based on average gains and losses over a standard 14-period formula, allowing traders to quantify market momentum and adjust settings depending on trading strategy.
Moreover, RSI divergence occurs when price and indicator move in opposite directions, signaling potential trend reversals such as bullish or bearish divergence.
RSI signals are interpreted through key levels like 30 (oversold) and 70 (overbought), helping traders decide when to enter or exit trades in both trending and ranging markets.
Therefore, RSI is widely used in forex and stock trading to improve entry timing and confirm trends, especially when combined with other technical indicators.
The RSI (Relative Strength Index) is a key indicator used to find potential buy and sell signals. To use it effectively, traders need to understand its meaning, calculation, and divergence behavior in different market conditions. More practical insights are available in the XM Guide.
RSI (Relative Strength Index) in technical analysis
The RSI (Relative Strength Index) serves as a core momentum oscillator in technical analysis, plotting a bounded mathematical value between 0 and 100 to evaluate the internal strength or weakness of an asset’s recent price action.

Statistically developed by J. Welles Wilder Jr. in 1978, this metric analyzes the ratio of higher closes to lower closes over a specific timeframe to determine if an asset is fundamentally overextended. By tracking this single line across your charting panel, you can instantly strip away short-term market noise, identify hidden institutional accumulation, and predict potential directional trend reversals before they reflect in the raw price bars.
What is RSI and how does it work in trading?
In active trading, the RSI operates as a technical momentum gauge that measures the speed at which an asset’s price is rising or falling. The indicator calculates price changes over a set number of historical candles—displaying a value that climbs toward 100 when upward price momentum is dominant, and dropping toward 0 when downward selling pressure accelerates. Because the resulting values are completely smoothed and normalized within a fixed vertical boundary, traders use it to instantly identify whether buyers or sellers are holding the upper hand in the current market cycle.
This standardized evaluation model explains why the oscillator remains a core component across diverse trading environments.
Why is RSI widely used in forex and stock markets?
The RSI is widely used across forex and stock markets because of its exceptional structural versatility and its verified ability to prevent traders from chasing bad entries. In the high-liquidity forex market, it helps day traders identify exhaustion points in major currency pairs, while in the stock market, it effectively highlights deep-value buying opportunities during corporate market sell-offs. Because its mathematical boundaries remain uniform regardless of the underlying asset’s price tag, it allows portfolio managers to apply a single, highly standardized momentum filter across thousands of entirely different corporate shares and global currency instruments simultaneously.
Once you have established its foundational role on your chart layouts, the next step is interpreting its specific numerical levels to isolate actionable trading signals.
RSI meaning and how to interpret its signals?
The core meaning of the RSI relies on identifying structural imbalances in market momentum, which are traditionally highlighted when the oscillator line crosses the definitive 70 and 30 boundary thresholds.
Reading crossing above 70 indicates a market that is entering an overextended bullish phase, whereas a reading plunging below 30 signals an aggressive, potentially exhausted bearish phase. Properly interpreting these mathematical zones provides traders with a reliable framework to forecast imminent corrections, manage open trade risk, and avoid buying at absolute market tops or selling at historical cyclical bottoms.
What do overbought and oversold levels mean?
In technical terms, overbought and oversold levels represent extreme statistical deviations from an asset’s underlying historical price mean:
- Overbought (RSI $$\g$$ 70): Indicates that buying momentum has accelerated too quickly, pushing the asset’s price to an unsustainable short-term premium that is highly vulnerable to profit-taking or a corrective pullback.
- Oversold (RSI $$\l$$ 30): Indicates that intense liquidation has driven prices down to a severe short-term discount, suggesting that selling pressure may be completely exhausted and a technical bounce is mathematically due.
However, reacting blindly to these levels without analyzing the broader macro environment can quickly lead to costly technical errors.
How to read RSI in trending vs ranging markets?
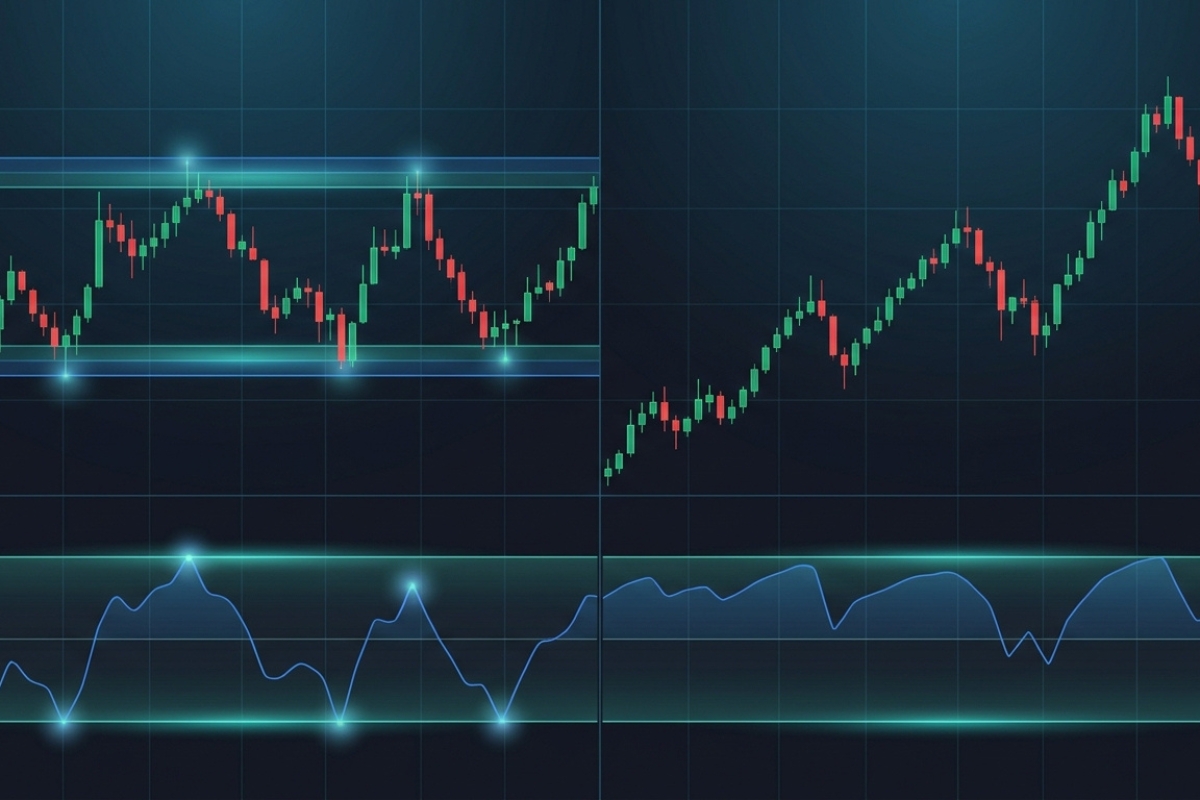
The way you interpret RSI signals must adapt completely depending on whether the asset is trapped in a horizontal range or running in a strong directional trend:
- In Ranging Markets: The traditional 70/30 boundaries work with high accuracy; the indicator tags 70 at horizontal resistance and 30 at horizontal support, offering clean mean-reversion reversal entries.
- In Strong Trending Markets: The indicator can remain “locked” in overbought or oversold territory for weeks at a time; during an aggressive uptrend, an RSI hitting 70 is a sign of strong trend continuation rather than an immediate sell signal, requiring traders to look for dips to the 40–50 midpoint line as buying opportunities.
To optimize these dynamic interpretations and protect your capital from false signals, you must master the underlying mathematical formula that constructs the oscillator line.
RSI calculation and formula explained
The calculation of the RSI relies on a multi-tiered mathematical formula that standardizes an asset’s average price gains and losses into a perfectly balanced percentage scale.

The formula is fundamentally structured as RSI = 100 – 100 / (1 + RS) , where the core variable RS (Relative Strength) represents the ratio of average up-closes to average down-closes over a designated historical window. By utilizing this specific smoothing technique, the calculation compresses raw price volatility into a clean, predictable curve, guaranteeing that the indicator value can never mathematically expand beyond its strict 0 and 100 parameters.
What is the RSI calculation formula?
The step-by-step mathematical engineering of the RSI formula operates through the following sequence:
- Calculate Change: Determine the net price change between the current close and the previous close for each candle.
- Separate Gains and Losses: Categorize positive changes as “Gains” and negative changes as “Losses.”
- Compute Averages: Calculate the exponential or smoothed moving average of the gains and losses over the chosen lookback period.
- Determine Relative Strength (RS): Divide the Average Gain by the Average Loss: RS = Average Gain \ Average Loss
- Normalize to 100: Apply the final smoothing equation to bind the value: RSI = 100 – 100 / (1 + RS)
To apply this formula practically on a modern trading terminal, you must select the appropriate historical lookback period for your strategy.
What is the standard RSI period and can it be adjusted?
The institutional standard for the RSI is the 14-period lookback, meaning the indicator calculates its momentum metrics using data from the last 14 consecutive chart candles. This standard parameter can be easily adjusted in your settings to alter the indicator’s overall sensitivity to price changes:
- Shortening the Period (e.g., 7 or 9 periods): Increases the oscillator’s volatility, causing the line to fluctuate rapidly and reach overbought/oversold zones more frequently, which benefits short-term scalpers but increases false signals.
- Lengthening the Period (e.g., 21 or 28 periods): Smooths out the indicator line significantly, reducing market noise and providing highly secure, reliable macro trend filters for long-term swing traders.
For traders looking to backtest these parameter adjustments across live markets, reviewing the educational guides and platform optimization modules on the MBroker provides an excellent environment to fine-tune your settings. Once your core calculation parameters are optimized, you can advance to tracking the most powerful leading signal the indicator can generate.
RSI divergence and trading signals
RSI divergence serves as an elite, leading technical trading signal that occurs when the structural trajectory of an asset’s raw price action completely disconnects from the directional path of the momentum line.
Statistically, divergence indicates that the underlying buying or selling volume driving a trend is actively drying up, even if the price is temporarily making a new visual extreme on the chart. Because momentum always precedes price, locating these structural discrepancies gives institutional investors an early warning that a major trend reversal is quietly forming behind the scenes.
What is RSI divergence in trading?
RSI divergence is a visual and mathematical anomaly where price creates a fresh swing high or low on your chart, but the oscillator line fails to mirror that exact structural expansion. Under normal conditions, higher asset prices should always generate higher momentum readings; when they do not, it proves that the prevailing trend is losing its core institutional backing. This structural disconnect acts as a highly reliable leading indicator, tipping off astute market participants that the current trend is exhausted and a sharp reversal is highly likely.
To trade this phenomenon successfully, you must learn to classify whether the incoming signal points to a bullish market floor or a bearish market ceiling.
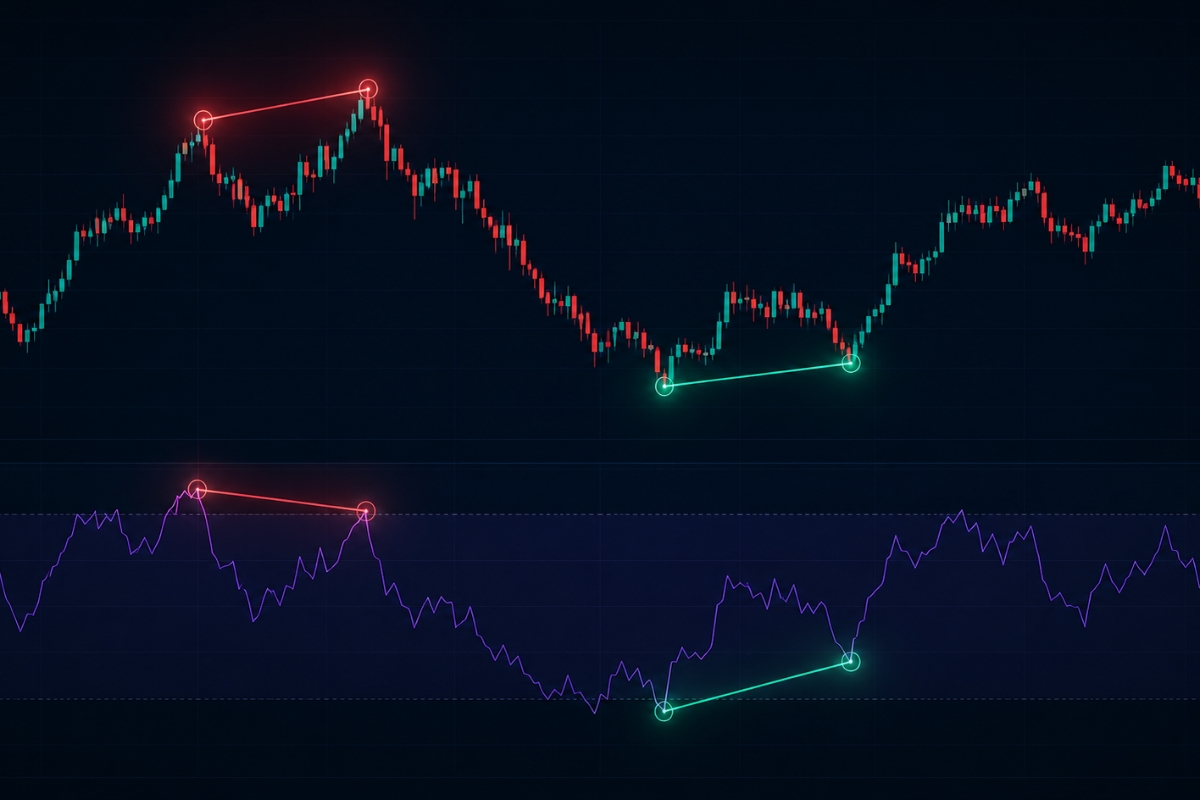
Bullish vs bearish divergence – how to trade them?
Divergence signals are split into two actionable trading profiles based on their directional implications:
- Bullish Divergence: Occurs when the asset price prints a lower low, but the RSI line establishes a clear higher low. To trade this setup, wait for the RSI line to cross back above the 30 level, placing your protective stop-loss just below the structural chart low.
- Bearish Divergence: Manifests when the asset price drives up to a higher high, but the RSI line stalls out and forms a distinct lower high. This proves that buying power is weakening, offering a high-probability short-entry trigger once the price breaks local structural support.
By systematically cross-referencing these divergence formations with institutional order execution speeds and advanced charting analysis toolkits detailed on the MBroker, you can easily minimize false breakouts, filter out bad entries, and optimize your overall portfolio win rate.
Mastering the RSI (Relative Strength Index) is essential for accurately timing your market entries and uncovering hidden structural reversals. By understanding its 14-period calculation formula, adapting your overbought/oversold interpretations to the broader market trend, and executing clear bullish or bearish divergences, you can transform volatile price fluctuations into a highly predictable, data-driven edge.

Thoren Vextal is a specialist in XM trading guides, offering practical insights and real-market experience to help traders improve their strategies and trading performance. Email: [email protected]