
 Tiếng Việt
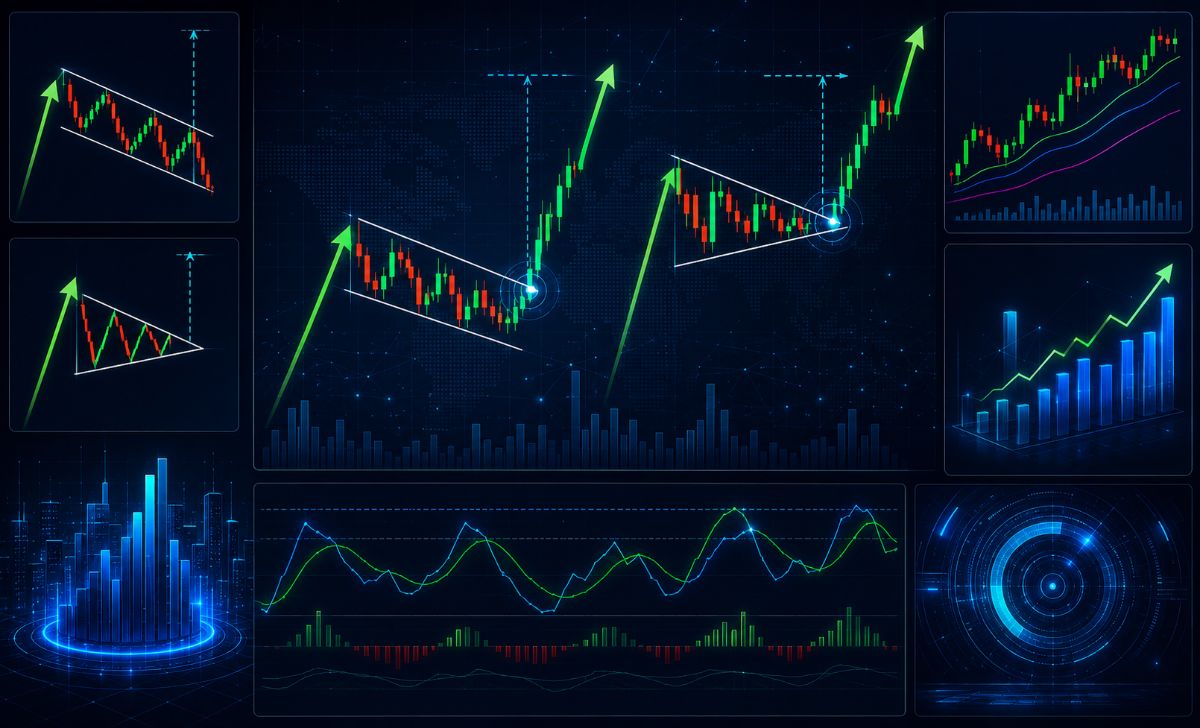
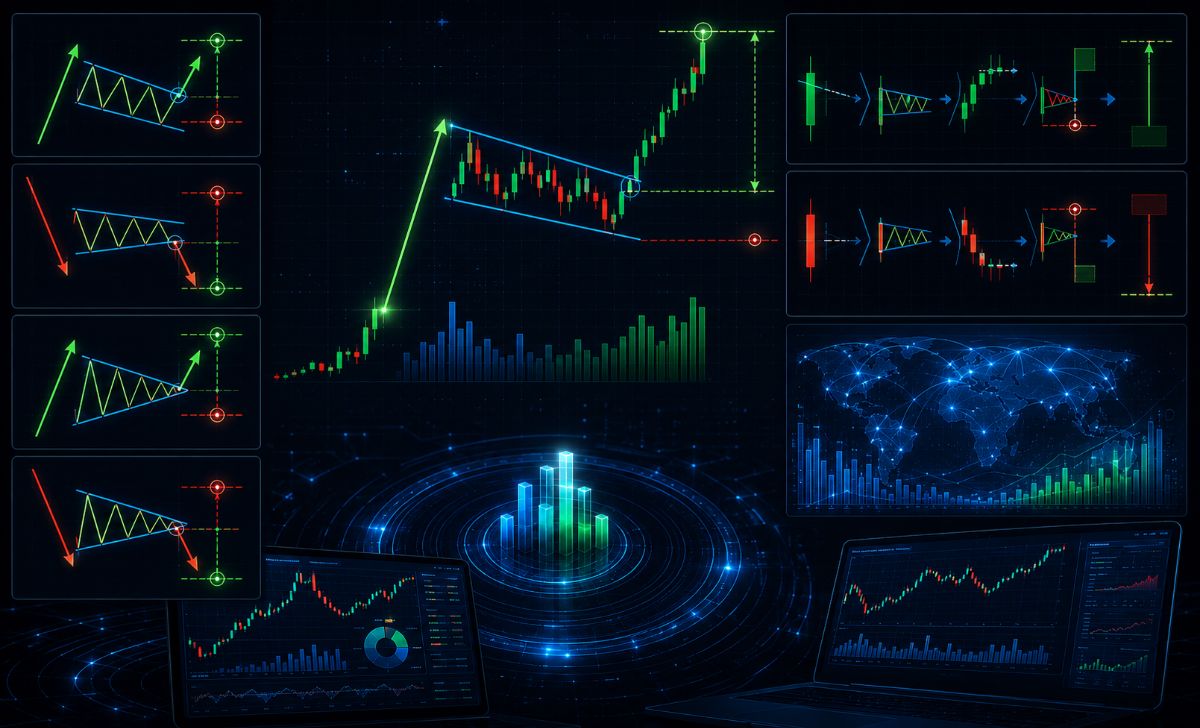
Flag and Pennant Patterns are trend continuation patterns with breakout signals typically occurring after a strong price move (flagpole), followed by consolidation before continuing the trend, widely used in breakout trading strategies.
Moreover, breakout trading based on these patterns works because price pauses in a tight range, then breaks out with momentum, offering high-probability entry points when combined with volume confirmation.
In addition, key signals include consolidation structure (flag or pennant), declining volume during formation, and volume expansion at breakout, helping traders validate trend continuation.
Furthermore, trend continuation logic behind these patterns reflects market psychology, where temporary profit-taking is followed by renewed buying or selling pressure in the original trend direction.
Finally, applying flag and pennant patterns in real trading requires strict risk management, proper stop-loss placement below/above consolidation, and avoiding false breakouts in low-volume or ranging markets.
Understanding Flag and Pennant Patterns helps traders identify breakout trading, confirm signals, and capture trend continuation in strong markets. Learn how to apply them effectively in the XM Guide at MBroker to improve your trading strategy.
Flag and pennant patterns in technical analysis
Flag and pennant patterns are short-term continuation price patterns that form when an asset experiences a sharp upward or downward move, followed by a brief period of consolidation, before resuming the original trend.
In technical analysis, these formations are highly regarded because they represent a temporary pause in a strong market trend, offering traders a high-probability entry point with a well-defined risk-to-reward ratio. Statistically, these patterns resolve as continuation structures in approximately 65% to 70% of cases, making them essential tools for momentum traders.
To utilize these structures effectively, we first need to break down their core definitions and structural anatomy.
What are flag and pennant patterns in trading?
Flag and pennant patterns are chart formations consisting of two main components: a “flagpole” (the initial sharp, high-volume price thrust) and a “flag” or “pennant” (the subsequent consolidation zone). The flagpole represents an aggressive influx of institutional buyers or sellers, pushing the price rapidly by 5% to 20% or more within a short period. The consolidation phase that follows represents profit-taking and a temporary equilibrium between supply and demand, where volume typically declines by 40% to 60%.
Once the market absorbs the excess supply or demand during this pause, buying or selling pressure resumes. This leads to a breakout in the direction of the prior flagpole, typically matching the vertical distance of that initial move. Understanding this basic structure allows us to examine the specific visual variations that distinguish one pattern from the other.
What is the difference between flag vs pennant pattern?
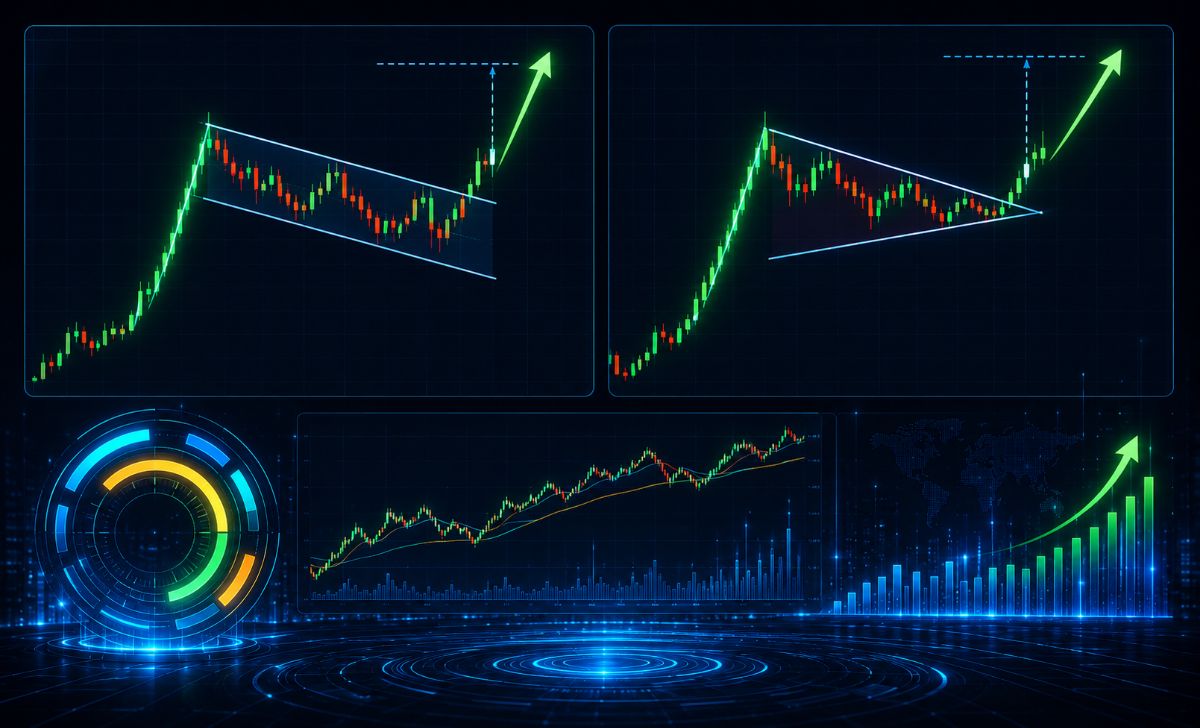
The primary difference between a flag vs pennant pattern lies in the geometric shape of their consolidation channels and the behavior of their boundary trendlines. A flag pattern features a rectangular consolidation channel formed by two parallel trendlines that slope against the prevailing trend (downward for a bullish flag, upward for a bearish flag). Conversely, a pennant pattern features a small, symmetrical triangular consolidation zone where the support and resistance trendlines converge toward an apex.
| Characteristic | Flag Pattern Trading | Pennant Pattern Trading |
| Consolidation Shape | Rectangular, parallel channel | Triangular, converging trendlines |
| Trendline Behavior | Slopes against the primary trend | Converges toward a central apex |
| Duration | Typically lasts 1 to 3 weeks | Typically shorter, lasting 1 to 2 weeks |
| Volume Profile | Slanted downward uniformly | Declines sharply toward the apex |
While their visual structures differ slightly, both chart formations share an identical underlying market psychology. Let’s explore the core mechanics driving this continuation logic.
Trend continuation logic behind flag and pennant patterns
The trend continuation logic behind flag and pennant patterns rests on the auction market theory of accumulation, distribution, and institutional order matching.
These patterns indicate continuation because the initial flagpole creates strong momentum that forces counter-trend traders out of their positions, while the consolidation phase allows institutional volume to pool without driving the price against their desired direction. When the market breaks out of this tight range, it confirms that the dominant trend-initiators still control the order flow.
To capitalize on these setups, traders must understand the psychological forces that cause these specific visual pauses to materialize on a chart.
Why do flag and pennant patterns indicate continuation?
These patterns indicate continuation because the brief consolidation phase represents a healthy market correction rather than a trend reversal. During a powerful market rally, early buyers begin to take profits, creating minor selling pressure. However, because the underlying demand remains incredibly strong, new buyers step in immediately at slightly lower prices, preventing the asset from retracing deeply.
This creates a tight, controlled range where the price retraces less than 38.2% or 50% of the initial flagpole distance based on Fibonacci levels. Because the broader market recognizes that sellers cannot push the price lower despite the profit-taking, the bias remains overwhelmingly tilted toward the original trend direction. This continuing effect, however, depends heavily on specific environmental conditions within the broader market.
What market conditions make these patterns reliable?
Flag and pennant pattern trading is most reliable during high-volume, well-defined macroeconomic trends or following major fundamental catalysts, such as corporate earnings beats or economic data releases. In a choppy, sideways, or low-liquidity market, these patterns frequently fail, leading to “false breakouts” or whipsaw price action.
Ideally, the pattern should develop on daily or 4-hour charts, where institutional participation is highest. Furthermore, the volume must follow a strict U-shaped or declining profile: massive volume during the flagpole formation, dry volume during the flag or pennant body, and a dramatic surge (at least 1.5 to 2 times the average 20-period volume) on the breakout candle.
Now that we understand the market environment required for success, let us analyze the specific signals required to validate these setups before executing a trade.
Key signals in flag and pennant pattern trading
The key signals in flag and pennant pattern trading center around a definitive candle close outside the consolidation trendlines, accompanied by a substantial expansion in trading volume.
A valid signal requires the price to breach the upper resistance line in a bullish setup, or the lower support line in a bearish setup, confirming that the consolidation period has officially concluded. Traders use these signals to differentiate between market noise and genuine institutional momentum.
Identifying the signal is only the first step; analyzing its core components is vital for accurate execution.
What are the main signals in flag and pennant patterns?
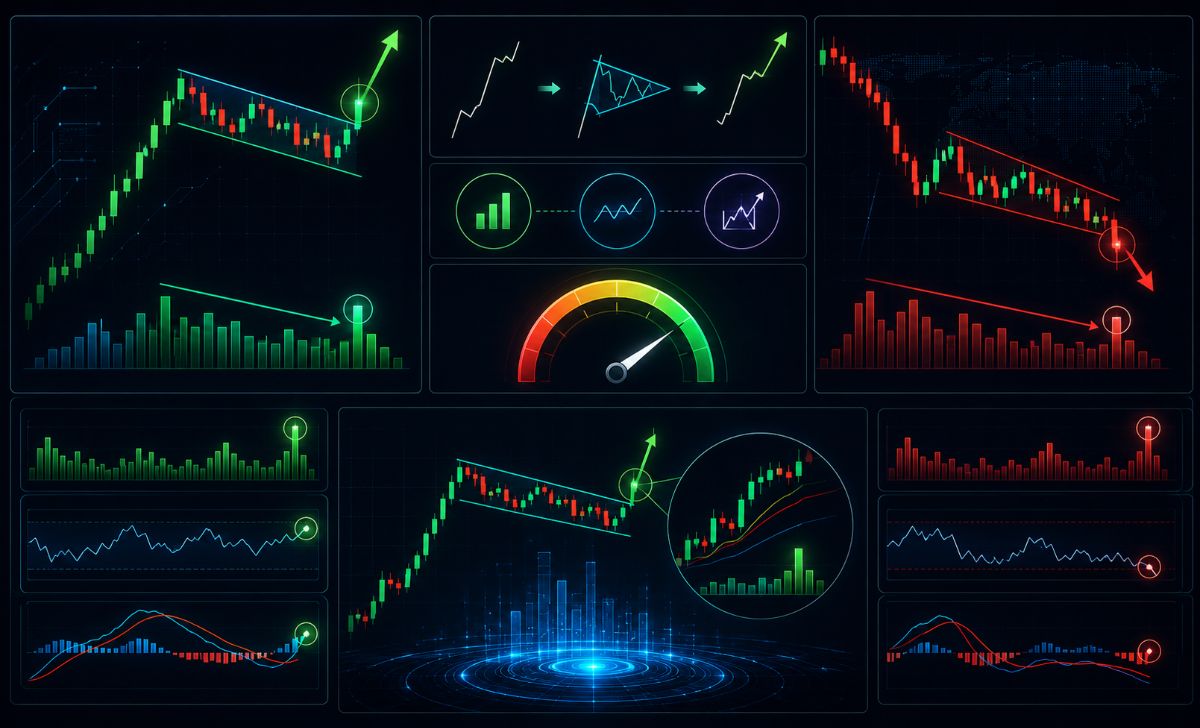
The main signals in these patterns consist of three interconnected technical events: the flagpole thrust, the volume decay during consolidation, and the breakout confirmation candle.
- The Thrust: A series of large-bodied candles moving aggressively in one direction.
- The Decay: A gradual reduction in daily trading volume as the price contracts within the flag or pennant borders, showing a lack of aggressive counter-trend selling or buying.
- The Breakout: A decisive candle that opens inside or near the consolidation zone but closes firmly outside of it, backed by an immediate spike in volume.
To avoid entering trades prematurely, you must implement strict filtering criteria to confirm these signals.
How to confirm valid signals before breakout?
To confirm valid signals before a breakout, traders should utilize multi-timeframe analysis and complementary technical indicators. First, check the volume profile; if the price attempts to break out on low or average volume, the signal is likely false. Second, use momentum oscillators like the Relative Strength Index (RSI) or MACD—during the consolidation phase, the RSI should cool down from overbought levels without dropping below the 50 centerline, indicating retained bullish strength.
Additionally, monitoring the order flow or waiting for a retest of the broken trendline on a lower timeframe (such as the 1-hour chart) can provide validation. For traders looking to automate these confirmations or find clean, institutional-grade charts with real-time pattern recognition, utilizing advanced market scanning platforms like MBroker provides a distinct competitive advantage.
Once a valid signal is confirmed, you can deploy a structured rule-based trading strategy to extract profit from the market.
Breakout trading strategy using flag and pennant patterns
A breakout trading strategy using flag and pennant patterns involves buying or selling short the exact moment the price breaks the pattern boundary, using the height of the initial flagpole to project an exact profit target.
This strategy is highly effective because it relies on momentum, meaning capital is deployed efficiently and trades typically reach their targets quickly. The mathematical beauty of this strategy lies in its asymmetric risk profile, often yielding risk-to-reward ratios of 1:2 or 1:3.
Let us look at a precise, systematic blueprint for executing this strategy seamlessly in the live markets.
What is a step-by-step breakout trading strategy?
To execute a flawless breakout trade, follow this five-step systematic protocol:
- Identify the Flagpole: Locate an aggressive, near-vertical price move at high volume.
- Map the Consolidation: Draw the parallel trendlines (flag) or converging trendlines (pennant) once at least four touchpoints (two highs and two lows) are established.
- Wait for the Candle Close: Enter the trade only when a candle closes completely outside the pattern boundary on the chosen timeframe.
- Set Risk Parameters: Place your protective stop loss order immediately based on the structural lows or highs of the consolidation zone.
- Project the Target: Measure the vertical distance of the flagpole in dollars or percentage, and project that exact distance upward or downward from the breakout point.
To ensure long-term profitability, these five entry steps must be balanced with strict, mathematical risk management parameters.
Where to place stop loss and take profit?
For a bullish flag or pennant, the stop loss should be placed just below the lowest support level of the consolidation structure, or alternatively, right below the breakout candle’s low to minimize capital exposure. The take profit target is calculated using the “measured move” approach: if the initial flagpole rally was $10 wide, your profit target should be placed exactly $10 above the breakout price line.
Conversely, for a bearish setup, the stop loss is placed right above the highest resistance trendline of the flag or pennant body, while the take profit is projected downward using the flagpole’s height.
With theoretical and strategic rules established, we can now look at how these dynamics manifest across different market trends.
Applying flag and pennant patterns in real trading
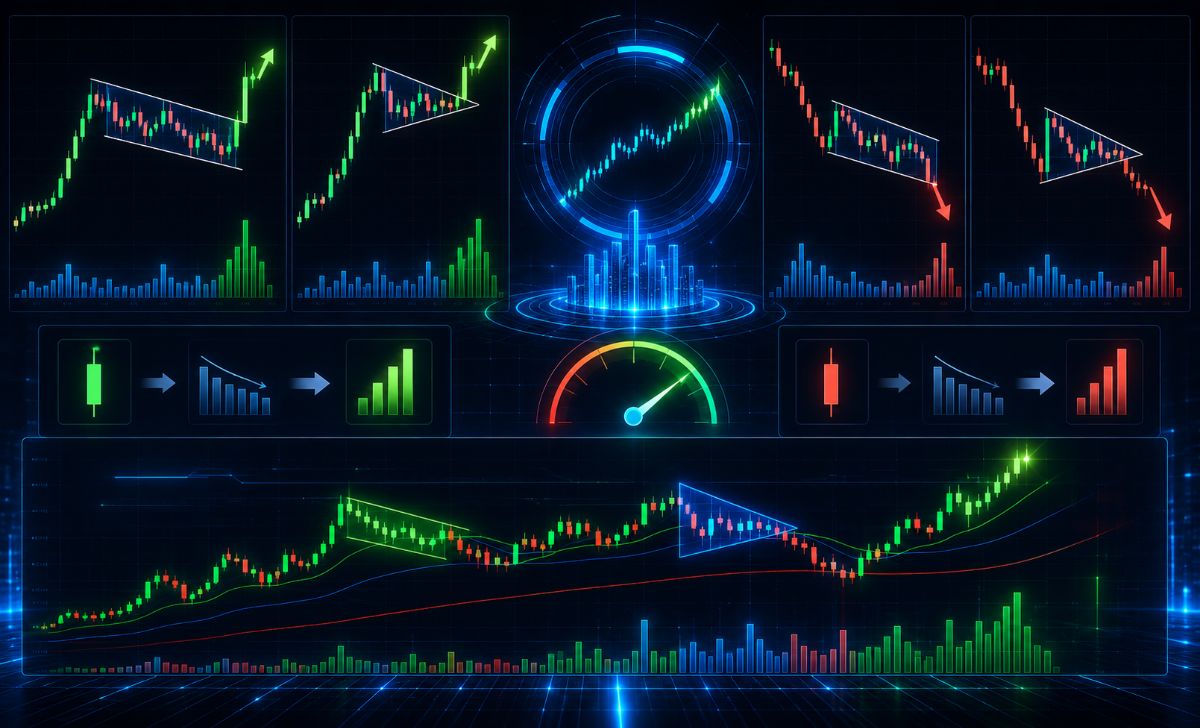
Applying flag and pennant patterns in real trading requires adapting to the distinct behavioral differences between rising and falling markets.

While the underlying mechanical principles remain consistent, bullish flags develop slower and rely on steady capital accumulation, whereas bearish flags develop rapidly due to panic-driven liquidations. Mastering both variations allows a trader to remain profitable regardless of whether the broader financial markets are rising or crashing.
To trade these setups effectively, we must look at practical execution techniques for both market conditions.
How to trade bullish and bearish flag patterns effectively?
When trading a bullish flag pattern, focus on assets that are trading above their 50-day and 200-day Exponential Moving Averages (EMAs). Enter long positions on a daily candle close above the upper resistance line, ensuring the volume is higher than the 20-day moving average of volume.
When trading a bearish flag pattern, look for sharp, high-volume drops (the flagpole) followed by a slow, low-volume upward-sloping retracement channel. Since markets drop faster than they rise due to fear, bearish breakouts often happen rapidly. Short positions should be opened immediately upon a clean break below the lower flag support, without necessarily waiting for a retest, as the downward momentum can cause the price to drop in a straight line.
Regardless of whether you are trading long or short setups, avoiding common psychological and technical pitfalls is crucial to protecting your trading capital.
What mistakes should traders avoid with these patterns?
Traders must avoid several critical mistakes when navigating flag and pennant pattern trading:
- Trading “Blind” Breakouts: Entering a position before the candle actually closes outside the pattern boundary, which often results in getting trapped in a false breakout.
- Ignoring the Volume Profile: Formations that occur with flat or rising volume during the consolidation phase are highly prone to failure.
- Chasing Overextended Flags: If the consolidation phase retraces more than 50% of the flagpole’s initial length, the pattern loses its momentum characteristics and turns into a standard trading range or a potential reversal structure.
- Trading in Illiquid Markets: Attempting to trade these patterns on micro-cap assets or low-volume timeframes where market manipulation and erratic price spikes are common.
By maintaining strict discipline, waiting for volume confirmation, utilizing reliable market data from platforms like MBroker, and adhering to measured risk-to-reward parameters, traders can successfully turn these highly reliable continuation patterns into a consistent source of profitability.

Thoren Vextal is a specialist in XM trading guides, offering practical insights and real-market experience to help traders improve their strategies and trading performance. Email: [email protected]