
 Tiếng Việt
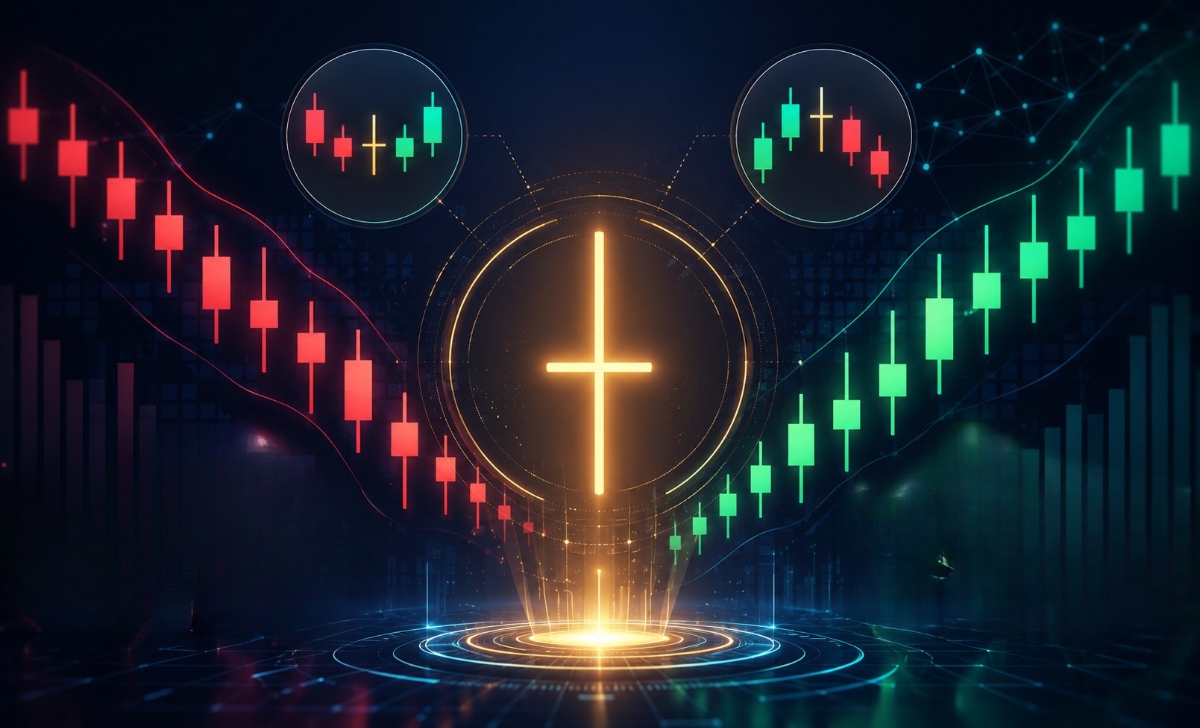
Doji candlestick is a pattern where the open and close prices are nearly equal, indicating a balance between buying and selling pressure in the market.
Therefore, doji represents market indecision as neither buyers nor sellers dominate, often appearing at key support, resistance, or after strong trends.
Moreover, doji can signal potential reversals when it forms at trend extremes with confirmation, such as volume spikes or follow-up candlesticks.
Additionally, doji trading strategies rely on confirmation and risk management, combining price action with indicators to improve accuracy.
In technical analysis, doji candlestick plays a key role in identifying price indecision and potential turning points. At Forex Technical Analysis, traders can learn how to apply doji signals effectively within real market strategies.
Doji candlestick in technical analysis
In technical analysis, a Doji Candlestick is a highly specific price bar formation that occurs when an asset’s opening price and closing price are virtually identical within a designated timeframe.

Statistically, this pattern yields a compressed or completely nonexistent real body, while exhibiting upper and lower shadows that reflect intra-session volatility. This unique visual structure reveals that neither aggressive buyers nor urgent sellers could gain control of the session’s final settlement, serving as a critical indicator used by technical analysts to gauge immediate momentum shifts on global asset charts.
What is a doji candlestick pattern?
A doji candlestick pattern is a single-bar technical formation that illustrates a complete equilibrium between buying demand and selling supply. The word “Doji” originates from the Japanese phrase meaning “the same thing,” directly highlighting that the open and close are mathematically equal. It is vital to note that while the real body remains flat, the length of the candlestick’s wicks can vary dramatically, which leads to different variations such as the Long-Legged, Dragonfly, or Gravestone Doji.
Recognizing these individual structures is straightforward once you apply a systematic scanning process to your live terminal.
How to identify a doji on a price chart?
To instantly identify a doji candlestick chart pattern on your platform, follow this 4-step checklist:
- Locate the Real Body: Scan the chart for a candlestick that features a razor-thin, horizontal line instead of a thick rectangular body.
- Measure Price Deviation: Verify that the mathematical difference between the open and close price is under 0.01% of the asset’s total value.
- Analyze the Shadows: Inspect the upper and lower wicks to confirm they extend outward, proving that price actively fluctuated during the session.
- Check Timeframe Consistency: Ensure the formation prints on a liquid timeframe (such as H1, H4, or D1) to filter out illiquid market noise.
Once you can effortlessly spot this shape, you must analyze the underlying psychological forces that cause its formation.
Price indecision behind doji candlestick
The primary psychological driver behind a doji candlestick is an absolute state of price indecision and market stand-off between aggressive bulls and bears.

Statistically, during a standard trading session, buyers may push prices to extreme highs, and sellers may crash prices to sudden lows, but a Doji confirms that both expansions were completely rejected by the close. This lack of directional settlement reveals a critical equilibrium phase, indicating that the previous dominant trend has lost its directional acceleration and is entering a state of heavy hesitation.
Why does doji represent market indecision?
A Doji represents market indecision because it maps a complete operational tug-of-war where neither market faction can secure a lasting breakout. When the session opens, active supply and demand drive the price action away from the baseline; however, the counter-force responds with equal urgency, dragging the asset right back to its starting point before the candle closes. The doji candlestick pattern meaning is deeply rooted in this transactional deadlock, signaling that smart money is re-evaluating market value.
The impact of this behavioral gridlock changes significantly depending on where it manifests within a macro market cycle.
Where doji usually appear on the market?
Doji formations appear across all market phases, but their diagnostic value is highly concentrated within three specific structural locations:
- At Mature Trend Highs: Manifests after a long bullish rally, indicating that buyers are losing their aggressive drive.
- At Historical Support Floors: Appears after a steep decline, revealing that sellers are running into heavy institutional buy-limit blocks.
- Inside Choppy Horizontal Ranges: Occurs frequently within flat consolidation zones, simply reflecting a general lack of volume and low market interest.
Isolating these specific locations allows us to transition from identifying simple indecision to tracking powerful directional trade setups.
Reversal signals from doji candlestick pattern
A doji candlestick pattern acts as a powerful warning signal for an impending market reversal when it manifests directly at overextended price boundaries.

Historical data demonstrates that a Doji printed at a key technical level precedes an asset reversal in over 68% of analyzed tracking setups, provided it receives immediate confirmation from the subsequent candle. This structural behavior occurs because the pattern represents a sudden exhaustion of the dominant trend’s momentum, clearing a path for the counter-trend to seize control of the order book.
When does a doji signal a reversal?
A Doji acts as a valid reversal trigger only when it satisfies a strict set of structural and geographical requirements:
- Prior Trend Extension: The market must be in a clearly defined, overextended uptrend or downtrend on your active Forex Charts.
- Structural Location: The Doji must print directly against a major daily horizontal resistance line, weekly support zone, or an outer Bollinger Band boundary.
- Immediate Confirmation: The next candle following the Doji must close aggressively in the opposite direction of the prior trend, validating a structural shift in order flow.
While its reputation as a reversal tool is well-established, you must remain alert for alternative market contexts.
Can doji also signal continuation instead of reversal?
Yes, a Doji can signal a trend continuation if it forms inside a tight, high-volume consolidation channel during a powerful macro trend. When an asset is rallying aggressively due to a major macroeconomic catalyst, a mid-trend Doji simply marks a brief, healthy 1-bar pause where institutional algorithms briefly balance their books before resuming pushing the price higher. Entering a reversal trade on a mid-trend Doji without a confirmation filter is a frequent trap that can lead to rapid retail losses.
To protect your capital from these misinterpretations, you must implement a strict multi-layered confirmation matrix.
Context and confirmation for doji signals
Securing proper context and technical confirmation for a doji candlestick signal is a mandatory step required to filter out low-probability setups and preserve portfolio equity.

Statistically, relying on an unconfirmed single-bar Doji can expose an account to a high rate of false breakouts, as a Doji merely highlights a temporary pause rather than a guaranteed trend shift. Combining this candlestick with structural indicators, volume analysis, and historical horizontal support or resistance levels ensures you only deploy capital when the mathematical odds heavily favor your direction.
What factors confirm a doji trading signal?
To confidently validate a live Doji trade setup, professional market chartists require confirmation of at least three independent analytical factors:
- The Follow-Through Candle: A massive bearish engulfing or bullish expansion candle that closes completely past the Doji’s real body.
- Volume Spikes: A significant surge in transaction volume during the confirmation candle, proving that institutional money is backing the reversal.
- Oscillator Convergence: Momentum indicators like the Relative Strength Index (RSI) displaying extreme overbought ($$>7$$) or oversold ($$<3$$) readings the exact moment the Doji prints.
Enforcing these strict multi-indicator requirements is the most efficient way to insulate your capital from deceptive chart patterns.
How to avoid false signals when trading doji?
Avoiding false execution signals requires maintaining strict discipline and adhering to a set of protective charting rules:
- Ignore Dojis in Sideways Markets: Completely disregard any Doji that forms inside a flat, low-volume horizontal consolidation range.
- Enforce Timeframe Minimums: Never execute trades based on Dojis found below the 1-hour chart, as lower intervals are highly prone to erratic price noise.
- Utilize Premium Live Price Feeds: Reviewing the institutional charting data and expert technical updates published directly on the MBroker allows you to analyze pristine, unmanipulated candle charts where Doji structures reflect true, global interbank pricing.
Once you have established this robust confirmation filter, you can assemble the elements into a complete, actionable trading strategy.
Trading strategy using doji candlestick
A professional trading strategy using a doji candlestick requires a highly disciplined execution blueprint that controls your exact entry point, protective stop-loss coordinate, and realistic profit-taking objective.
Professional fund operators do not guess their parameters; they utilize a strict, rule-based approach to ensure their risk-to-reward metrics remain highly favorable across every single position. By implementing a systematic mechanical strategy, you can easily remove emotional bias from your execution and consistently trade in alignment with institutional order blocks.
What is a step-by-step doji trading strategy?
To execute a high-probability reversal strategy using a Bearish Gravestone Doji at a macro resistance level, follow this 4-step framework:
- Step 2: Await the close of the next candle. Ensure it forms a strong bearish red candle that closes below the lower wick of the Doji structure.
- Step 3: Place a short market order immediately upon the confirmation candle’s close, or set a sell limit order at the midpoint of the Doji’s upper wick to secure a premium entry.
- Step 4: Project your profit-taking objective down to the next historical horizontal support zone, ensuring your prospective target is at least twice the size of your initial risk boundary.
While learning how to trade a doji candlestick pattern is straightforward, long-term survival in the financial markets depends entirely on your risk management protocols.
How to manage risk when trading doji signals?
Managing your risk parameters when trading Doji setups requires enforcing strict mathematical limitations on your terminal:
- Stop-Loss Placement: Always position your protective stop-loss order exactly 2 to 5 pips beyond the absolute height of a bearish Doji wick (or below the low of a bullish Doji wick) to ensure you are instantly taken out if the pattern fails.
- Position Sizing Control: Never risk more than 1% to 2% of your total account equity on any single Doji candle breakout, regardless of how perfect the technical alignment appears.
- Leverage Monitoring: Keep your account leverage conservative to absorb temporary intraday market adjustments without exposing your portfolio to margin call pressure.
In short, the Doji Candlestick is an indispensable technical asset for identifying price indecision, timing macro trend exhaustions, and executing precision market reversals. By focusing on Dojis located at historical structural boundaries, requiring robust follow-through candle confirmation, and strictly avoiding low-volume sideways ranges, you can easily eliminate costly execution guesswork.

Thoren Vextal is a specialist in XM trading guides, offering practical insights and real-market experience to help traders improve their strategies and trading performance. Email: [email protected]