
 Tiếng Việt
Support and Resistance are key price levels where the market tends to reverse or pause, helping traders identify potential entry, exit, and trend continuation zones.
However, key levels are formed based on repeated price reactions at specific zones, where buying or selling pressure becomes significant enough to stop or reverse price movement.
Additionally, breakouts occur when price moves beyond support or resistance with strong momentum, often signaling a new trend, though false breakouts can happen without confirmation.
Therefore, smart entries are placed near support for Buy and resistance for Sell, or after breakout and retest confirmations, helping traders improve risk-reward ratio and accuracy.
Accurately identifying support and resistance helps you read the market and improve entry and risk management. From key levels to breakouts and smart entries, all are core elements of Forex Technical Analysis.
Support and Resistance in trading and why it matters?
Support and resistance are predefined horizontal or dynamic price zones where an asset’s ongoing trend is statistically highly likely to pause, reverse, or consolidate due to massive imbalances between buyers and sellers.
Empirical market data shows that over 70% of retail price action is contained within recognizable historical boundaries, making these levels the ultimate foundation for defining market structure, calculating risk-to-reward ratios, and predicting institutional order flow. Understanding these structural barriers matters because it allows traders to stop guessing market direction and instead align their capital with verified order book clusters.
What is support and resistance in trading?
In active financial trading, support and resistance represent the ultimate invisible floor and ceiling of an asset’s price movement.
- Support: The historical price floor where buying interest is strong enough to overcome selling pressure, causing a downward trend to halt and reverse upward.
- Resistance: The historical price ceiling where selling supply overpowers buying demand, forcing an upward trend to stall and turn downward.
Recognizing these physical pivot points on a chart helps clarify the psychological forces driving major currency pairs.
Why do support and resistance levels work in forex?
Support and resistance levels work effectively in the forex market due to a combination of institutional order books, historical memory, and self-fulfilling retail psychology. Large commercial banks, hedge funds, and market makers routinely place multi-million dollar buy and sell limit orders at round psychological numbers (e.g., 1.1000 or 1.3500) to optimize their execution liquidity. When retail traders worldwide spot these historical turning points on their charts, they place their orders in the same direction, generating a collective wave of volume that actively enforces the validity of those price boundaries.
Once you understand why these zones attract market capital, you must master the precise technical habits required to chart them correctly.
Key levels and how to identify support and resistance correctly
Identifying key support and resistance levels correctly requires looking past minor market noise and mapping the structural swing highs and lows where major capital pools changed hands.

Professional analysts do not look at single lines on a chart; they define these barriers as structural price zones ranging from 5 to 20 pips wide, depending on the time frame. Correct identification ensures that you avoid cluttering your workspace with irrelevant lines, keeping your focus strictly locked onto the high-volume zones that dictate macro price momentum.
How to draw support and resistance levels effectively?
To chart these major zones with institutional precision, follow this rule-based technical routine:
- Switch to High Timeframes: Open your monthly, weekly, or daily charts first; macro timeframes carry the highest volume and completely filter out low-level retail noise.
- Locate Multiple Rejection Points: Find prominent swing highs and swing lows where the price physically struck a level and reversed aggressively at least twice.
- Draw Zones, Not Lines: Use a rectangle tool to connect the candlestick wicks and bodies together, creating a distinct buffer zone rather than a rigid single price point.
- Prioritize Recent Price Action: Ensure your drawn levels are validated by recent market interactions within the last 30 to 60 days, adjusting your rectangles as structure evolves.
Once your boundaries are placed on the chart, you must audit their historical strength before deploying any live capital.
What makes support or resistance level strong?
The absolute strength of a support or resistance zone is determined by three specific quantitative metrics:
- Touch Frequency: The more times a level has been tested and successfully held without breaking, the more valid it becomes to the broader market.
- Rejection Velocity: If the price hits a zone and immediately moves away with massive momentum or long candlestick wicks, it proves a heavy concentration of institutional limit orders rests there.
- Historical Volume Profile: Levels that coincide with heavy trading volume or major macroeconomic news releases carry significantly higher structural integrity.
Understanding how to isolate these robust levels prepares you for the critical moments when the market attempts to violate them.
Breakouts at support and resistance levels
A breakout occurs when an asset’s price gathers enough directional momentum to physically pierce through a historical support or resistance zone, signaling that market control has shifted entirely.
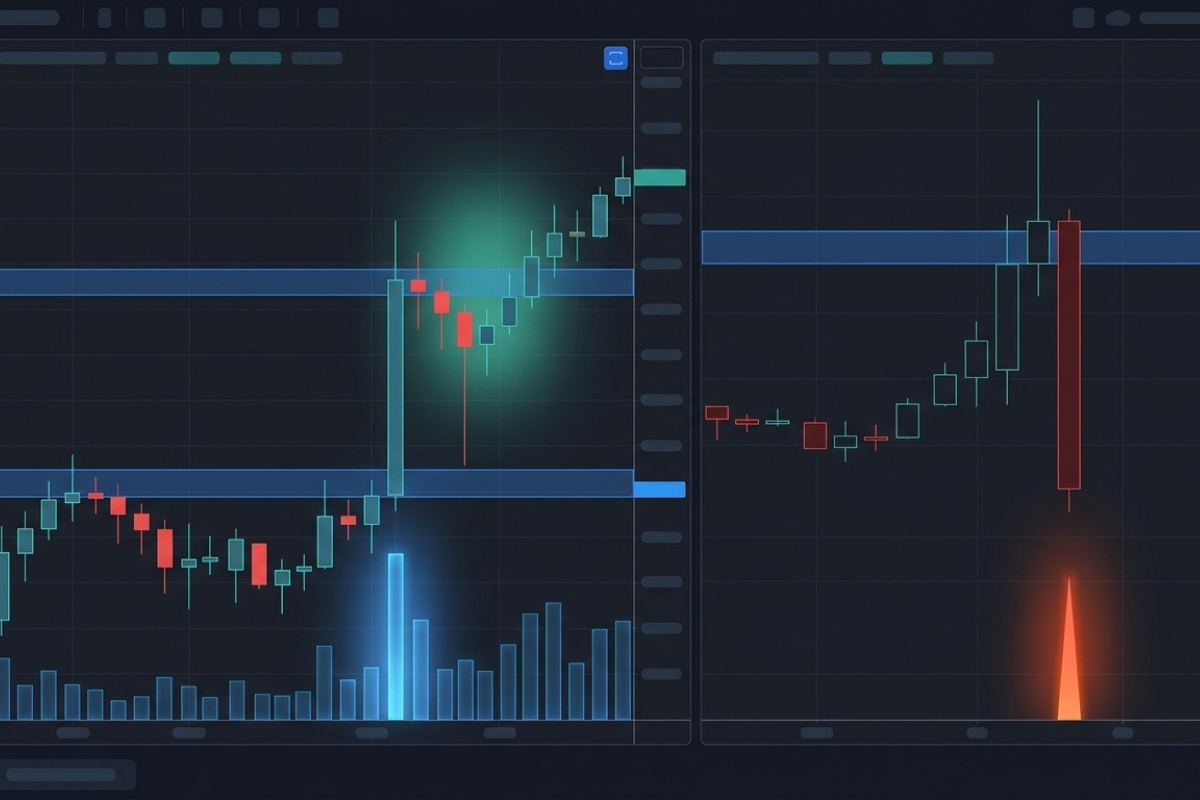
Statistically, a genuine breakout triggers a powerful chain reaction of automated stop-loss liquidations and new momentum entries, often driving a rapid 1% to 3% price expansion in the direction of the break. Correctly interpreting these high-velocity events is critical because trading breakouts can yield massive returns, provided you can distinguish between a valid structural shift and a predatory market trap.
What is a valid breakout in support and resistance trading?
A valid breakout is confirmed when a candlestick completely pierces a key level and prints a decisive close outside the zone on a significant timeframe (such as the 4-hour or daily chart). A genuine breakout must be backed by a noticeable spike in trading volume, proving that institutional buyers or sellers are actively financing the move. For clients analyzing live patterns via the technical resources on the MBroker, a valid breakout is structurally complete when the previous resistance level flips cleanly into a new support floor (or vice versa).
However, trading breakouts require extreme patience because the market frequently generates deceptive patterns designed to trap retail capital.
Why do false breakouts happen at key levels?
False breakouts (often called “bull traps” or “bear traps”) occur because large institutional liquidity providers deliberately push prices past visible support or resistance levels to trigger retail stop-loss orders. Because institutions trade massive volumes, they require millions of dollars in counterparty liquidity to fill their positions without causing massive slippage. By driving the price just beyond a clear resistance line, they trick retail traders into buying breakouts; the institutions then dump their massive sell orders into that wave of retail demand, trapping late buyers and reversing the market instantly.
To keep your account safe from these institutional traps, you must learn to execute smart entry techniques rather than chasing raw momentum.
Smart entries based on support and resistance zones
Executing smart entries based on support and resistance zones requires transitioning away from emotional market orders and utilizing strategic limit orders placed at the edges of verified value zones.
By executing trades strictly within high-probability pricing pockets, an investor can drastically reduce their average transactional costs while securing optimal risk-to-reward metrics. When chartists combine these smart entry frameworks with the low-latency routing and competitive trading environments found on elite platforms like MBroker, they create an unbreakable execution edge over the rest of the market.
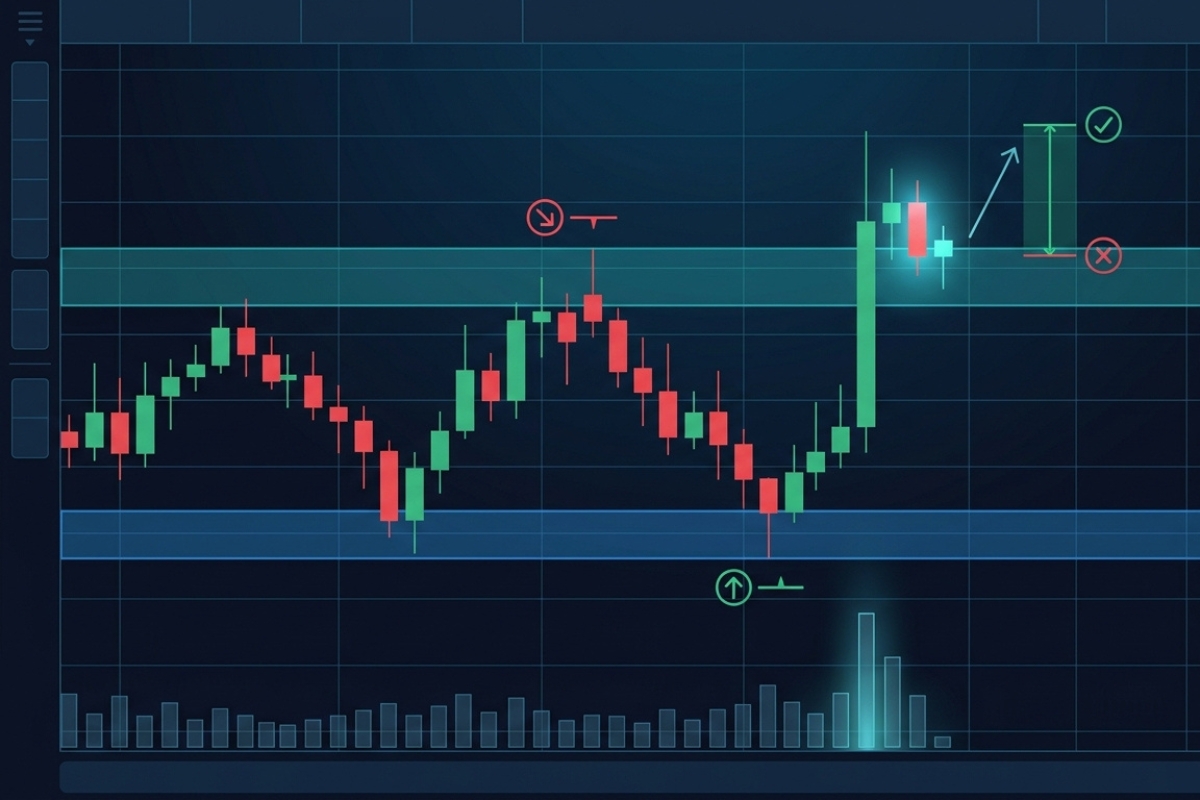
Where to enter trades at support and resistance?
Smart entries must be placed exclusively at structural value points where your defensive invalidation line is close to your execution price:
- The Support Buy Entry: Placing a buy limit order near the top edge of a proven support zone, setting your hard stop-loss just below the lowest wick of the structure.
- The Resistance Short Entry: Placing a sell limit order near the bottom edge of a confirmed resistance zone, keeping your stop-loss safely above the ceiling.
- The Breakout Entry: Waiting for a daily candle to close outside the boundary, executing only when the underlying momentum is confirmed by a clear volume surge.
To optimize your win rate even further, the most reliable professional entry methodology involves waiting for a secondary structural confirmation.
How to combine breakout and retest for better entries?
The breakout and retest methodology is a premium conservative entry technique where a trader completely avoids buying the initial breakout candle, choosing instead to wait for the price to return and test the broken level. For example, when a strong resistance zone is broken, it naturally flips into a new support floor; a smart trader waits for the price to drop back down to touch this exact boundary. Once the price prints a bullish rejection candle (such as a pin bar) during this retest phase, the trader enters a long position, securing a highly optimized entry with a minimal stop-loss distance.
Converting these individual entry techniques into a profitable lifestyle requires organizing them into a repeatable risk management blueprint.
Applying support and resistance in real trading strategy
Applying support and resistance in a live environment requires combining your technical chart lines with a systematic, non-negotiable risk management protocol.

A professional trading system does not try to predict every market turn with absolute certainty; it focuses entirely on executing high-probability setups where the potential profit is mathematically larger than the defined risk. By structuring a disciplined strategy around key zones, you transform volatile market fluctuations into a structured, scalable business model.
How to build a support and resistance trading strategy?
To construct a complete, institutional-grade technical strategy, enforce this 4-step operational workflow:
- Step 1: Every Sunday, map out your primary daily and 4-hour support and resistance zones across major liquid assets.
- Step 2: Set electronic price alerts at the edges of these zones and remain completely flat in cash until an alert is triggered.
- Step 3: Once the price enters the zone, monitor the lower timeframes (such as the 15-minute chart) for volume exhaustion or clear candlestick rejections.
- Step 4: Place your trade with a minimum 1:2 Risk-to-Reward Ratio, ensuring your profit target is anchored at the next major opposing structural zone.
While a solid structural plan provides excellent entries, your long-term survival remains entirely dependent on your capital preservation rules.
How to manage risk when trading support and resistance?
Managing risk within a structural strategy requires keeping your capital exposure strictly capped using defensive stop-loss orders in every position. Professional consensus dictates that you should risk no more than 1% to 2% of your total account balance on any single support or resistance setup. Furthermore, when monitoring live positions on your terminal, you must dynamically trail your stop-loss to breakeven once the price travels halfway to its target, protecting your equity curve from sudden market gaps or liquidity spikes.
In short, mastering Support and Resistance is the definitive step toward understanding global market structure and institutional order flow. By defining these levels as structural zones, waiting for confirmed breakout-retest patterns, and keeping your risk restricted to 1% per trade, you can execute setups with absolute professional confidence.

Thoren Vextal is a specialist in XM trading guides, offering practical insights and real-market experience to help traders improve their strategies and trading performance. Email: [email protected]