
 Tiếng Việt
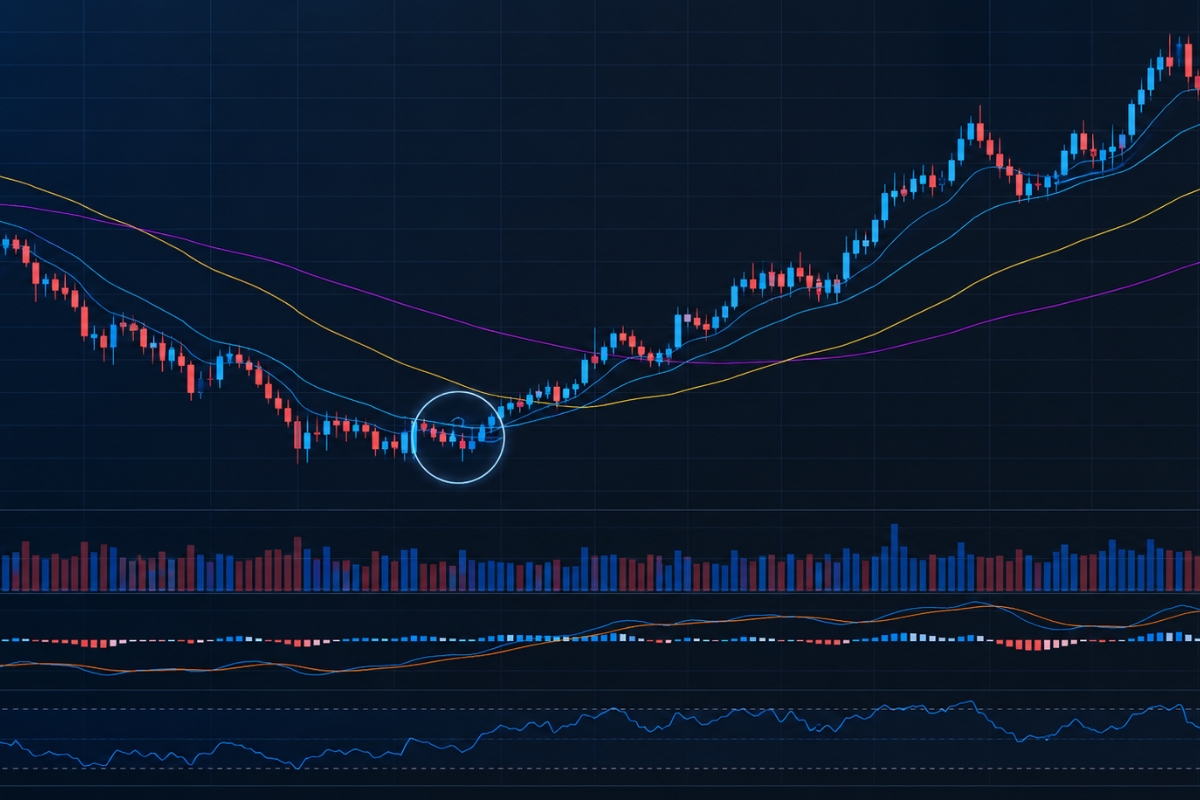
Moving averages are indicators of smooth price data to identify market trends, allowing traders to filter out short-term noise and focus on the overall direction.
However, the moving averages method is calculated based on the average price over a specific period, with common types like SMA and EMA differing in responsiveness to price changes.
Additionally, moving average crossovers provide key buy and sell signals, such as the Golden Cross for bullish trends and the Death Cross for bearish trends.
Therefore, moving averages are widely used in trading strategies to determine entry and exit points, often combined with other indicators to improve accuracy.
Finally, moving averages help traders identify and confirm market trends across forex and stock markets, supporting more informed and trend-following trading decisions.
In technical analysis, Moving Averages are one of the most essential tools used to identify trends, generate signals, and improve trading decisions. Understanding how they work helps traders navigate market movements with greater accuracy.
Trading in moving averages and technical analysis
Moving averages are lagging technical indicators that smooth out historical price action by calculating a constantly updated mathematical mean over a specified number of data points.
By smoothing out erratic, short-term price spikes, these indicators allow market participants to clearly visualize the underlying market trajectory over days, weeks, or months. In live trading environments, they function as dynamic, psychological boundaries of support and resistance, providing a clear visual anchor that prevents retail traders from opening high-risk positions against the dominant macro momentum.
What are moving averages and why do traders use them?
Moving averages are quantitative indicators that average a security’s historical price fluctuations into a clean, fluid line that runs directly alongside or across the price bars. Financial professional use them primarily because they strip away the chaotic “market noise” generated by high-frequency algorithmic execution and sudden, low-volume sentiment shifts. By analyzing the slope and positioning of this smoothed line, an investor can instantly determine whether an asset is in a healthy structural uptrend or a decaying downtrend without relying on emotional guesswork.
While all moving averages serve this core purpose, the mathematical formulas used to construct them split the indicator into two primary variations.
What are the main types of moving averages (SMA, EMA)?
The global financial markets rely heavily on two primary architectural types of moving averages:
- Simple Moving Average (SMA): This model calculates the straight arithmetic mean of a asset’s closing prices over a specific timeframe, treating every individual day in the data set with equal mathematical weight.
- Exponential Moving Average (EMA): This model applies a higher mathematical multiplier to the most recent price data points, making it significantly more sensitive to breaking news, immediate volume surges, and sudden market reversals.
Understanding these structural differences allows you to choose the exact calculation parameters that match your system’s execution speed.
Moving averages method and how they work?
The moving averages method works by continually dropping the oldest historical data point from the calculation pool whenever a new price candle closes, ensuring the visual line remains strictly bound to current market conditions.

In practice, this structural rolling mechanism means a 20-day average will always evaluate only the 20 most recent daily closing values on your terminal. By utilizing this mathematical smoothing cycle, the indicator establishes a structural, historical benchmark that helps traders identify whether current market pricing is overextended or trading at an attractive relative discount.
How is a moving average calculated?
The mathematical calculation behind a moving average depends entirely on the specific formula model you choose to deploy. The standard m – period Simple Moving Average is calculated by summing up the closing prices over that period and dividing the total by n:
SMA = ( P_1 + P_2 ) \ (dots + P_n)
For the Exponential Moving Average, the calculation incorporates a smoothing constant, denoted as k = 2 \ (n + 1), ensuring that the current day’s close dominates the indicator’s real-time position: EMA (Today) = ( Price x k ) + ( EMA (Yesterday) x (1 – k))
Converting these complex formulas into a functional technical setup requires selecting a period setting that aligns perfectly with your investment horizon.
How to choose the right moving average period?
Choosing the correct calculation period depends entirely on whether your strategy targets short-term day trading margins or long-term portfolio asset growth:
- Short-Term Trading (Scalping/Day Trading): Deploy the 9, 12, or 21-period EMA to capture quick intraday momentum shifts and secure fast exits before trends reverse.
- Medium-Term Trading (Swing Trading): Implement the 50-period SMA or EMA to track multi-week trends and identify primary structural pullbacks.
- Long-Term Investing (Position Trading): Rely on the 200-period SMA, which represents the gold standard on Wall Street for defining macro bull and bear market boundaries.
Once you have established your preferred periods, you can begin combining multiple lines to generate highly predictive execution signals.
Crossovers moving averages and trading signals
A moving average crossover signal is an automated technical trigger that occurs when two distinct moving averages with different tracking speeds physically intersect on a price chart.

These crossover events highlight an organic shift in structural market momentum, proving that short-term order flow is rapidly outpacing long-term historical price patterns. Because these technical intersections reflect large-scale institutional volume reallocations, they are widely monitored by automated trading algorithms to trigger systematic entry, exit, and risk-mitigation protocols across global financial networks.
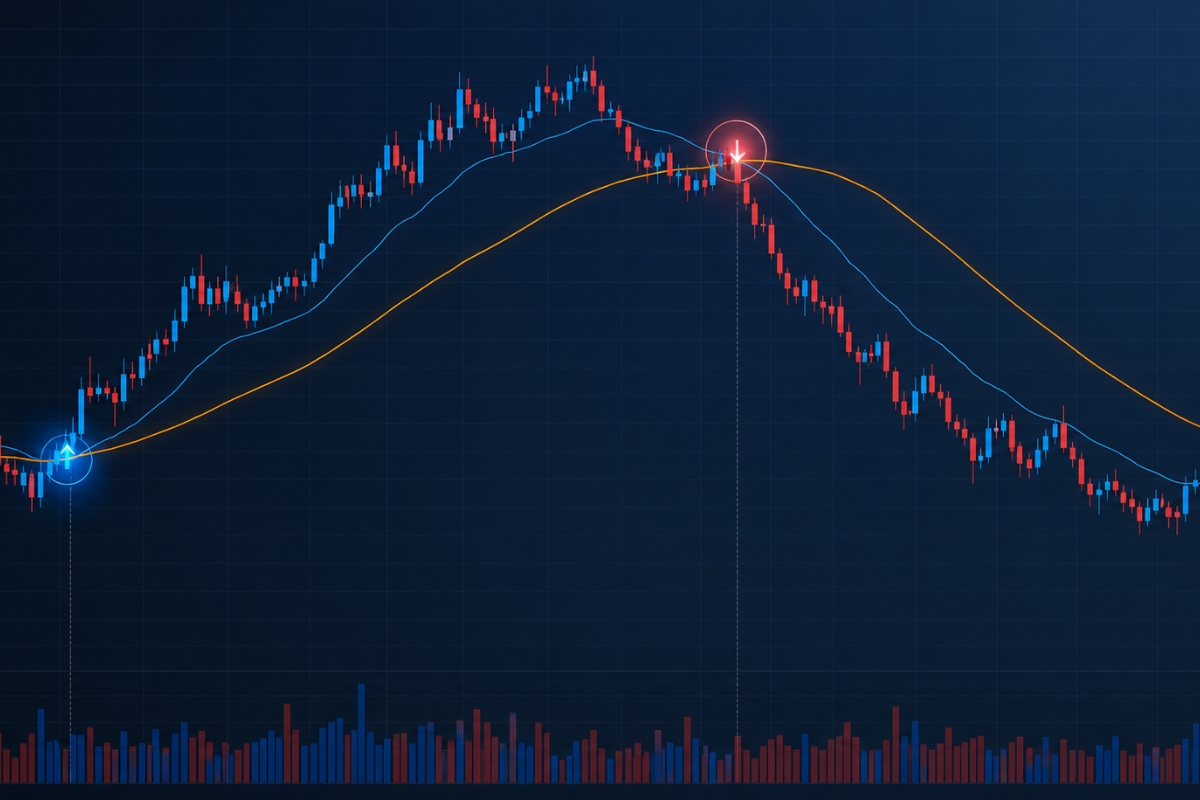
What is a moving average crossover signal?
A crossover signal functions as a momentum filter by tracking the relative distance between a fast-moving average and a slow-moving average. When the fast line crosses aggressively above the slow line, it confirms that recent buyers are driving prices upward at a faster rate than the historical average, generating a mechanical buy signal. Conversely, when the fast average breaks below the slow average, it proves that downside selling pressure is accelerating, flashing a systematic warning to liquidate long holdings or initiate short positions.
Among the infinite variations of this crossover mechanic, two specific long-term setups govern major market cycles.
Golden cross vs death cross – what do they indicate?
The Golden Cross and Death Cross are powerful macro-technical patterns that utilize the 50-day and 200-day Simple Moving Averages to predict major economic cycle shifts:
- The Golden Cross: Occurs when the 50-day SMA crosses above the 200-day SMA, indicating a powerful shift from a long-term bear market into a structural, high-probability bull market phase.
- The Death Cross: Occurs when the 50-day SMA breaks below the 200-day SMA, serving as a warning of impending institutional liquidation and signaling a structural transition into a macro downtrend.
Transitioning these mechanical signals from abstract observations into a profitable, rule-based operation requires embedding them into a defined execution strategy.
Moving average trading strategy in real markets
A moving average trading strategy provides a rule-based execution framework that removes human emotion by defining exact price invalidation points and profit targets based on moving average levels.
In real markets, a basic strategy will use the moving average line as a trailing dynamic trigger, keeping a trader locked into a strong trend while automatically signaling an exit when the structural momentum stalls. When traders run these rule-based strategies within high-performance execution environments—such as those highlighted on platforms like MBroker they gain a major psychological and mathematical advantage over unorganized market speculators.
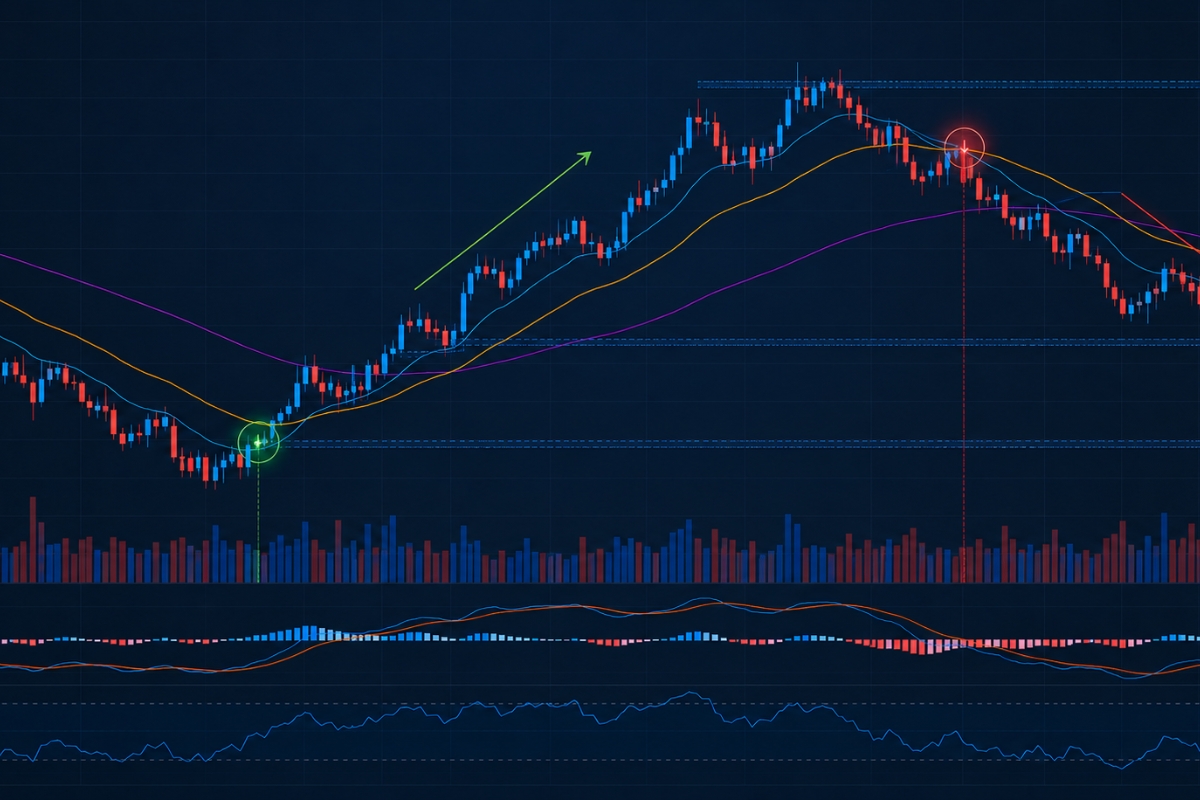
What is a basic moving averages trading strategy?
The most reliable foundational moving average strategy is the “Trend-Pullback System,” which relies on a combination of a fast average (e.g., 20 EMA) and a slow average (e.g., 50 EMA) to identify structural trends. Traders wait for a clear crossover to confirm a directional trend, and then patiently wait for price to execute a minor technical pullback to touch the 20 EMA line. An order is executed immediately upon this retest, placing a protective stop-loss directly behind the 50 EMA structure, creating a highly asymmetrical risk-to-reward setup that targets a minimum 1:2 payoff ratio.
However, executing this basic strategy blindly in flat, range-bound markets can lead to repetitive false signals, known as “whipsaws.”
How to combine moving averages with other indicators?
To effectively eliminate whipsaw losses during non-trending market conditions, you must filter your moving average signals using secondary, non-correlated indicators:
- Moving Averages + RSI: Only accept a bullish moving average crossover if the Relative Strength Index (RSI) is coming out of oversold territory (below 30), ensuring you aren’t buying at the exact top of an exhausted move.
- Moving Averages + MACD: Cross-reference your moving average entries with the MACD histogram; an entry is only validated when the MACD confirmation lines align in the same directional vector.
- Moving Averages + Volume Profile: Ensure that breakout signals across a long-term moving average line are backed by an institutional spike in trading volume, validating genuine market participation.
By mastering this multi-layered technical filter, you can transition from simple execution to deep macro-trend analysis across different asset classes.
Using moving averages to analyze market trends
Using moving averages to analyze market trends allows an investor to evaluate the broader structural lifecycle of an asset class across global exchange networks.
By identifying the relative spatial orientation between live price action and the slope of long-term rolling averages, analysts can accurately categorize markets into accumulation, markup, distribution, or markdown phases. This macro-level structural filtering ensures that your capital is always allocated to the highest-momentum sectors while automatically shielding your balance sheet from collapsing markets.
How do moving averages identify market trends?
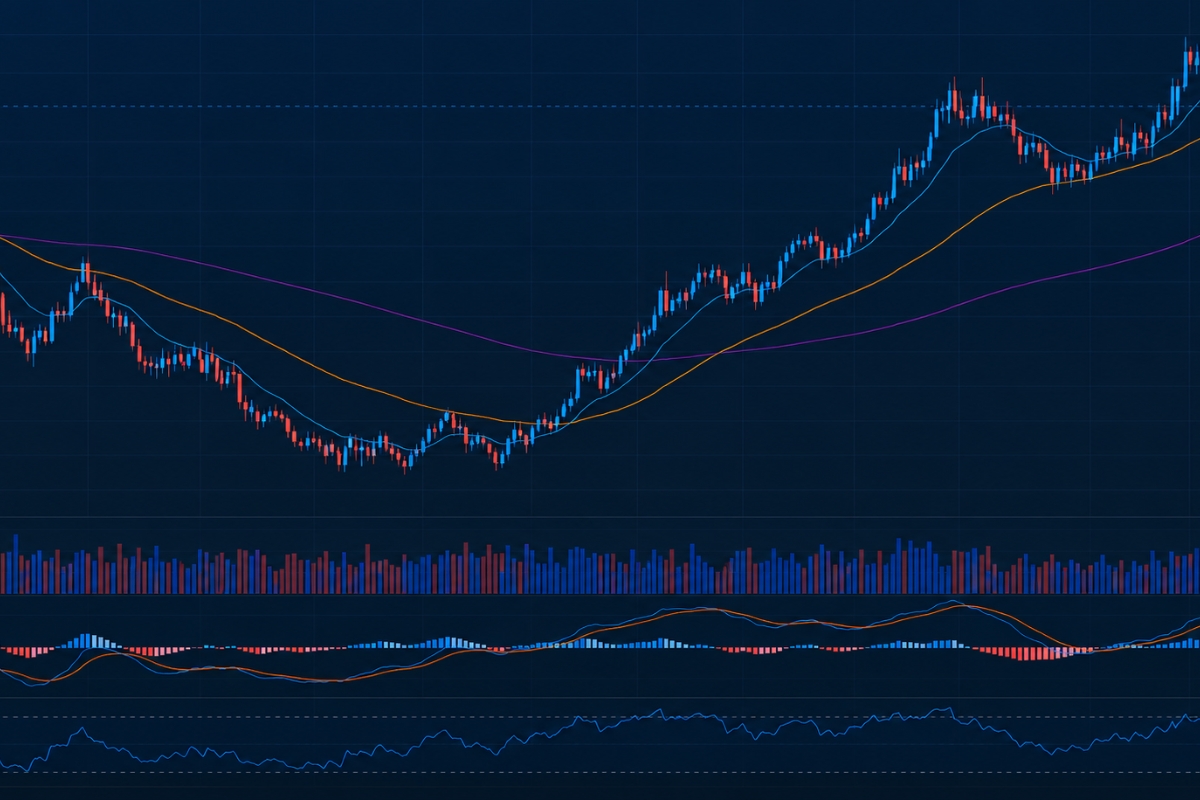
Moving averages define the state of a market trend through three primary visual metrics:
- The Slope of the Line: An upward-sloping moving average confirms an active, healthy uptrend, while a downward-sloping line indicates a dominant downtrend.
- Price Location: When the live market candles are consistently tracking above the moving average line, the indicator acts as a dynamic floor of support, confirming buyer control.
- Line Separation: In a powerful trend, multiple moving averages (like the 20, 50, and 200) will fan out in perfect sequential order, visualizing a high-momentum market phase.
Understanding these trend-identification parameters is crucial because their real-world applications vary depending on the underlying structure of the marketplace you are trading in.
How are moving averages used in forex and stock markets?
In the stock market, moving averages are heavily utilized as institutional benchmarks, where institutional fund managers monitor key levels like the 50-day and 200-day SMA to trigger large-scale portfolio rebalancing, mutual fund asset allocations, and corporate stock buyback programs. In the decentralized forex market, chartists heavily favor fast-adjusting exponential averages (Forex Charts set with 9, 21, and 100 EMAs) to navigate the rapid, high-leverage intraday liquidity shifts driven by global central bank interest rate differentials. For traders seeking to refine these system configurations and access premium educational resources, reviewing the expert market insights available on the XM Guide provides a reliable foundation for mastering institutional trend execution.
In short, Moving Averages are the definitive cornerstone of professional trend analysis, providing an objective, mathematical framework to filter market noise and isolate genuine momentum. By choosing the right average type, masterfully tracking crossover signals, and combining these lines with volume filters, you can easily eliminate emotional guesswork from your execution routine.

Thoren Vextal is a specialist in XM trading guides, offering practical insights and real-market experience to help traders improve their strategies and trading performance. Email: [email protected]