
 Tiếng Việt
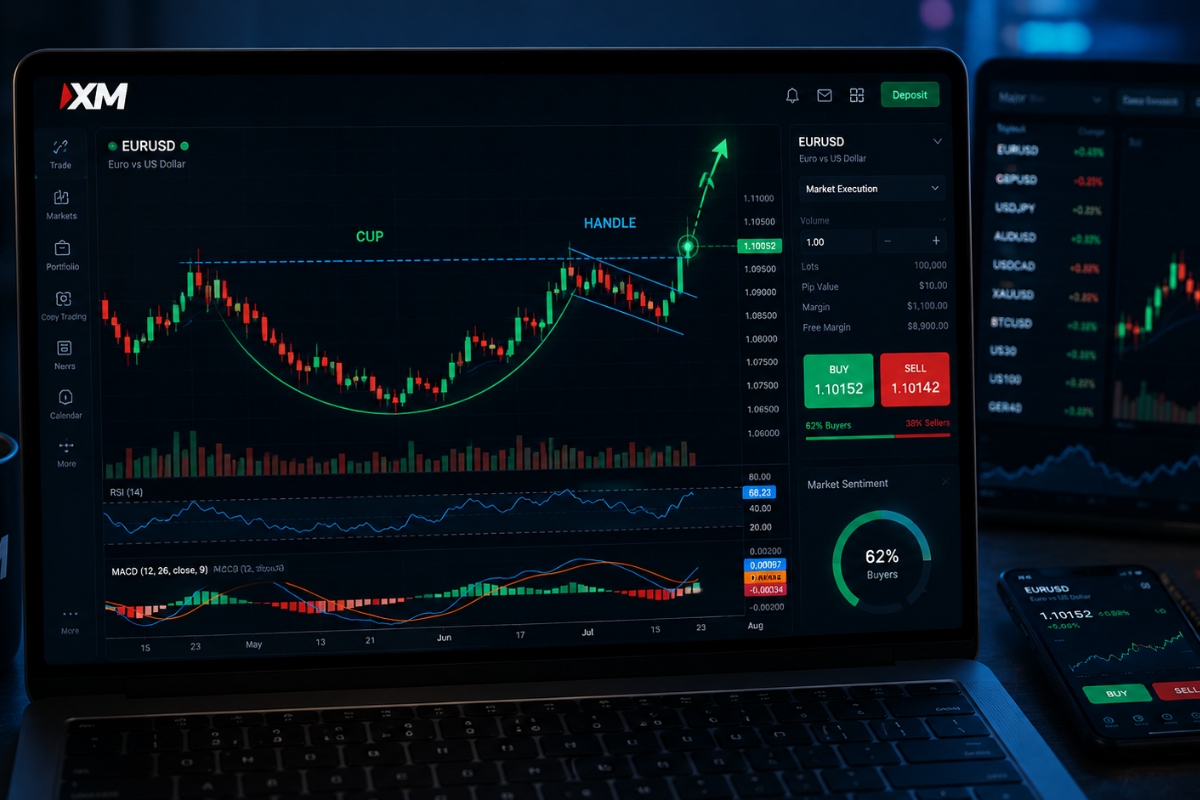
Cup and Handle Pattern is a bullish continuation pattern that signals a potential price breakout after consolidation, commonly used to identify strong upward trends in financial markets.
To spot a valid Cup and Handle Pattern, traders must identify a rounded “cup” followed by a small consolidation “handle” before breakout, ensuring volume confirmation and proper structure.
Additionally, traders can apply Cup and Handle Pattern effectively on XM platforms using MT4/MT5 charts, allowing real-time analysis and execution across multiple timeframes.
A common strategy is to enter at the breakout above handle resistance and set targets based on cup depth, while managing risk with stop-loss below the handle.
Moreover, tools like Chartink, MT4/MT5 indicators, and charting software help identify and confirm Cup and Handle Pattern accurately, improving trading precision and decision-making.
If you want to master trading on XM, understanding chart patterns like the Cup and Handle is just the beginning. Explore more step-by-step tutorials and practical insights in the XM Guide category to improve your trading skills and strategies.
What is Cup and Handle Pattern and why it matters in trading?
The Cup and Handle Pattern is a high-probability bullish continuation setup that alerts traders that a prevailing uptrend is taking a healthy breather before resuming its upward trajectory. Statistically, this pattern yields a success rate of over 65% to 70% when identified correctly on higher timeframes, making it an invaluable asset for portfolio growth. It matters immensely because it gives institutional and retail investors a clear, low-risk entry point back into a strong bull market with mathematically defined profit targets.
To master this formation, we must first break down its specific anatomy and analyze the emotional undercurrents of the market participants driving it.
What is the structure of a Cup and Handle Pattern?
The structural anatomy of a Cup and Handle Pattern resembles a classic tea cup viewed from the side, consisting of two primary components:
- The Cup: A smooth, “U-shaped” consolidation bowl that forms after an initial aggressive rally. It features a left rim (previously high), a rounded bottom (selling exhaustion), and a right rim that rises back to near the left rim’s level.
- The Handle: A brief, downward-sloping consolidation channel or flag that develops after the right rim is formed. This handle represents the final shakeout of weak buyers before the price pushes through the overhead resistance line, known as the neckline.
This geometric shape is not an accident; it is the visual footprint of a deep macroeconomic narrative.
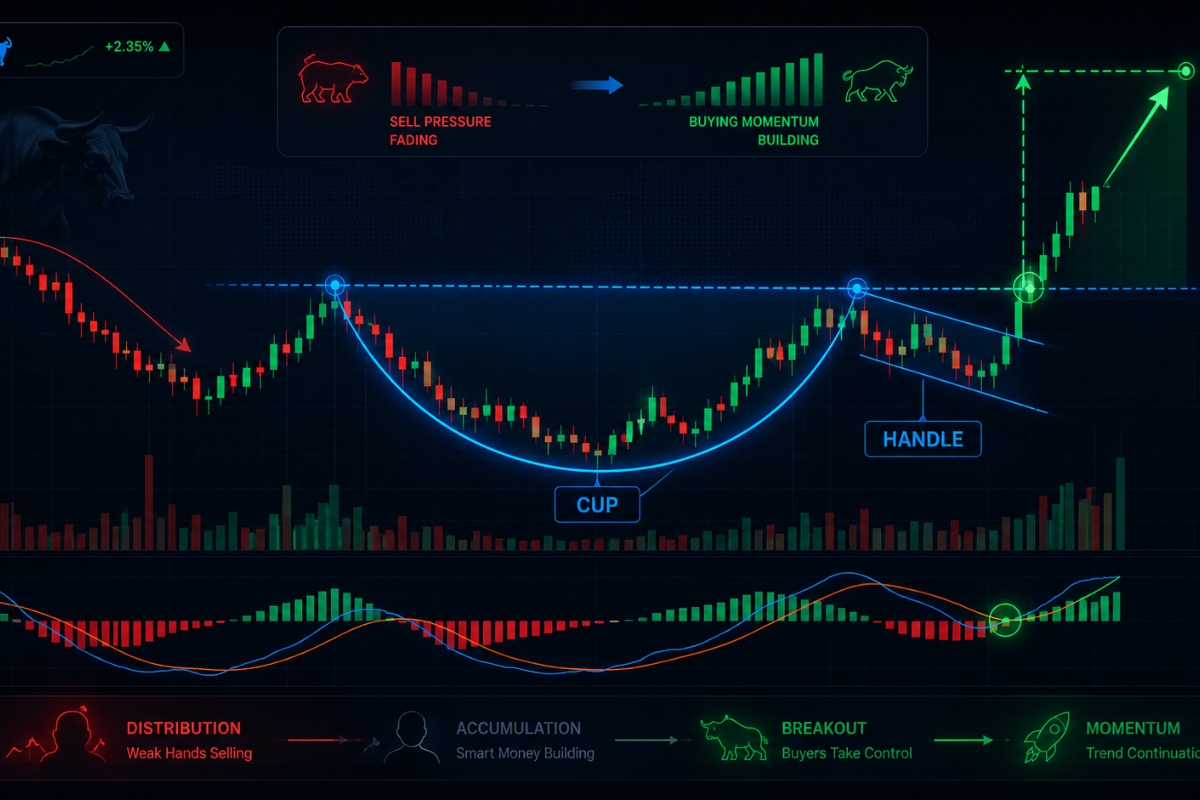
What market psychology drives this pattern?
The psychological journey of a Cup and Handle structure transitions directly from profit-taking to institutional accumulation. As the initial uptrend hits the left rim, large institutions begin locking in gains, causing a gradual price decline toward the bottom of the cup, where selling pressure dries up.
When buyers realize the asset is at a steep discount, they slowly accumulate positions, lifting the price back to the right rim; here, a final, minor bout of fear creates the handle, which quickly fails as aggressive bulls overwhelm the remaining short-sellers, sparking the final breakout.
Once you comprehend the psychological blueprint, the next step is learning how to filter out false variations on a live chart.
How to spot Cup and Handle Pattern on charts?
Spotting a valid Cup and Handle Pattern requires a strict, rule-based approach to prevent traders from misidentifying random market noise as a reliable setup.
A textbook pattern must occur after an established, measurable uptrend that has gained at least 30% in value prior to the cup’s formation. If the cup develops in a vacuum or during a harsh secular downtrend, the pattern’s validity drops significantly, turning what looked like a bullish floor into a continuation trap.
Isolating the precise structural characteristics of this formation is essential for accurate market forecasting.
What are the key signs of a valid pattern?
When scanning your charts, ensure the asset checks off the following mandatory parameters:
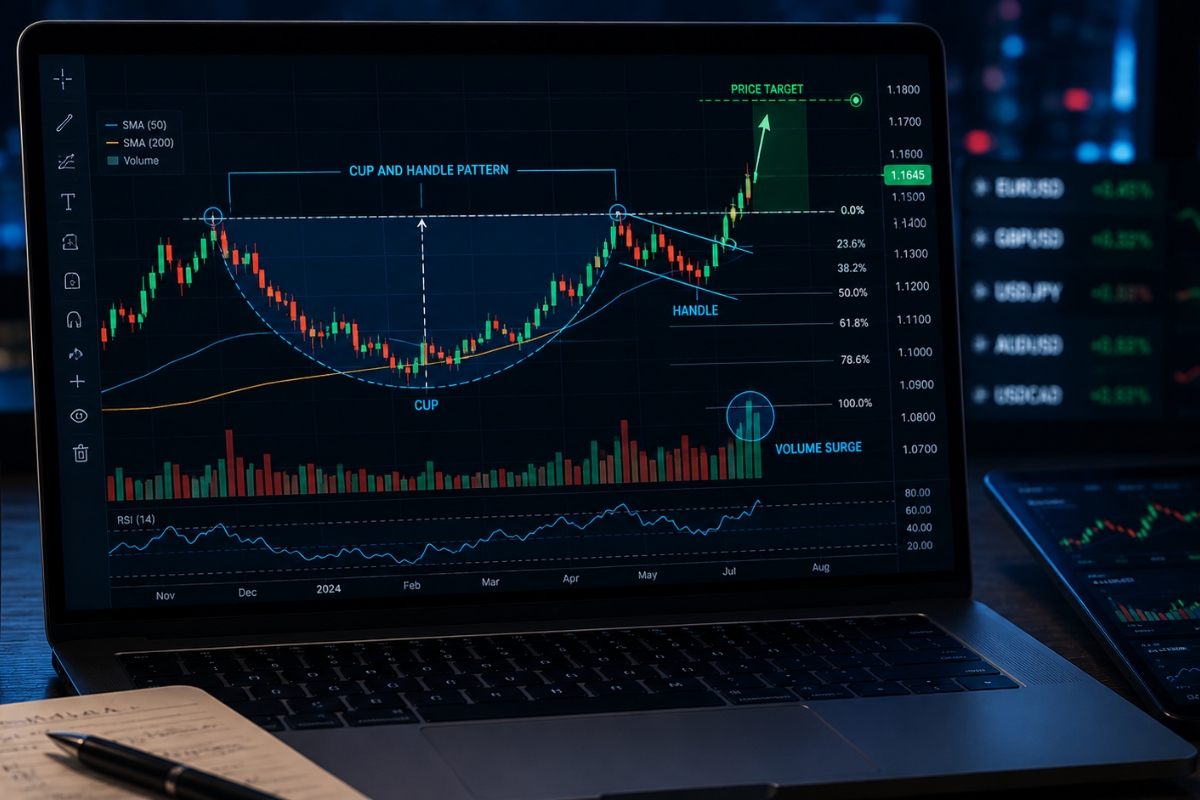
- U-Shaped Bottom: The cup must be rounded and smooth, not a sharp “V-shape,” which indicates a premature, unstable rejection.
- Depth Restrictions: The depth of the cup should ideally retrace between 33% and 50% of the preceding uptrend; anything deeper than 62% signals structural weakness.
- Handle Proportions: The handle must form within the upper third of the cup’s total height and should not retrace more than 50% of the handle’s preceding upward move.
- Volume Profile: Volume should contract noticeably during the bottom of the cup and the formation of the handle, followed by a massive expansion on the breakout day.
Failing to verify these precise guidelines frequently leads to costly execution errors.
What mistakes should traders avoid when spotting it?
The most devastating mistake retail market participants make is trading a deep “V” bottom and calling it a cup, which lacks the necessary accumulation time to sustain a long-term rally. Another common trap is entering a trade while the handle is actively collapsing below the lower half of the cup, which invalidates the pattern and indicates a potential double top or head-and-shoulders breakdown.
By avoiding these visual pitfalls, you can confidently apply this structure to advanced execution platforms like XM.
How to apply Cup and Handle Pattern in XM trading?
Applying the Cup and Handle Pattern within the XM trading ecosystem allows investors to leverage ultra-low latency and highly reliable multi-asset order routing. Because XM offers fractional pip pricing and a renowned “No Re-quotes” policy, traders can execute breakout orders at the exact microsecond the neckline resistance is breached. This technical synergy ensures that the narrow spreads of the XM Ultra Low account type directly preserve your profit margins during high-velocity breakout moves.
To deploy this setup successfully on XM, you must master the operational workflow and choose the correct conditional filters.
How to trade Cup and Handle Pattern on XM?
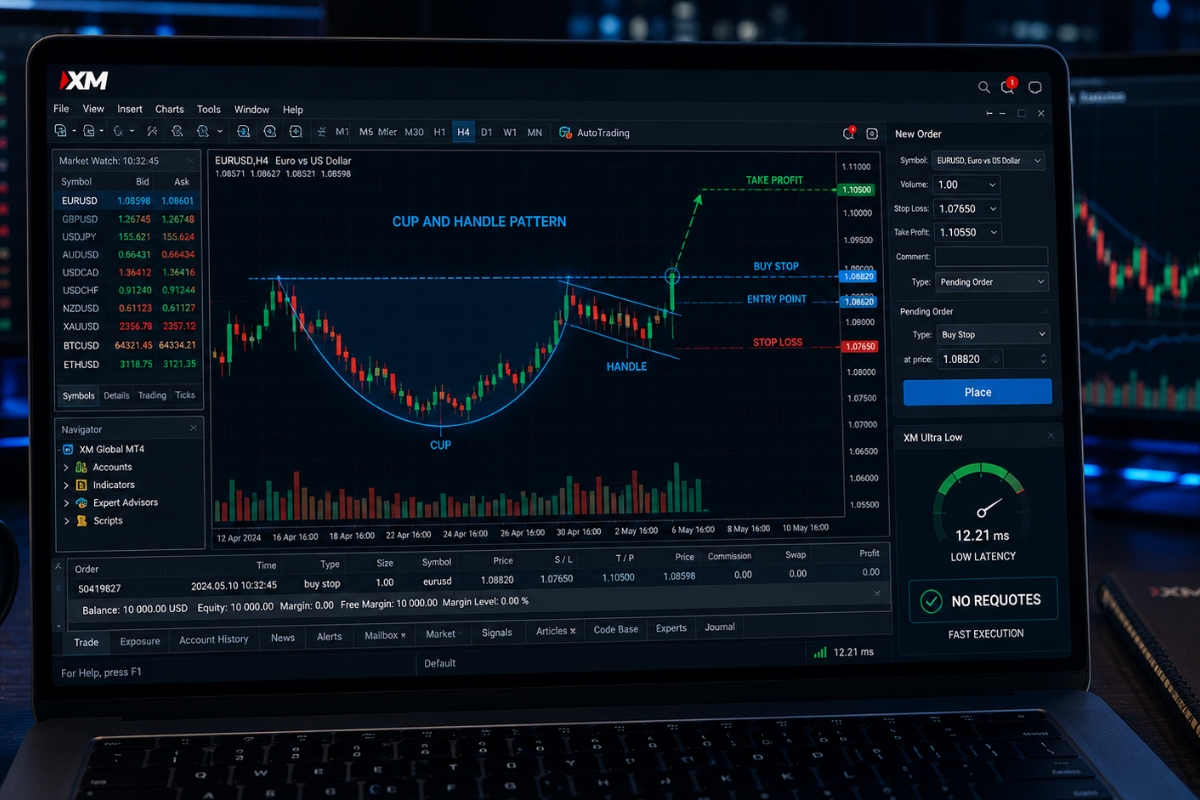
Trading this structure on the XM MetaTrader 4 or MetaTrader 5 terminal involves a precise, technical process:
- Step 1: Identify a well-formed cup on your asset’s chart and draw a horizontal resistance line across the two rims.
- Step 2: Place a Buy Stop pending order slightly above the handle’s highest resistance level to capture the momentum automatically.
- Step 3: Use XM’s advanced order ticket to configure a guaranteed Stop Loss and Take Profit simultaneously, eliminating emotional interference.
- This automated pending-order method prevents you from chasing the market if the initial breakout candle moves too quickly.
However, your execution settings must be calibrated to the specific timeframe you are monitoring.
Which timeframe works best on XM platforms?
The Cup and Handle formation is structurally more reliable on macro timeframes, with the Daily (D1) and 4-Hour (H4) charts offering the highest historical win rates. Lower timeframes, such as the 15-minute or 5-minute charts, suffer from heavy market noise and liquidity gaps, leading to frequent false breakouts. For subscribers aligning their trading models with the institutional insights found at MBroker, focusing on the H4 and D1 intervals ensures your setups match major commercial liquidity pools.
Once the platform parameters are established, you can refine your entry, exit, and capital protection rules.
Trading strategy using Cup and Handle Pattern
A professional trading strategy utilizing the Cup and Handle Pattern relies on strict geometric measurements and mechanical execution. The entry is mathematically defined by the breach of the handle’s resistance, while the ultimate target is projected directly from the deepest point of the cup. By standardizing these rules, you transform a simple visual observation into a repeatable, statistical business model that removes greed and fear from the equation.

Let’s break down the exact mathematical execution rules and risk parameters for this strategy.
Where to enter and set targets?
The optimal strategy follows a precise structural measurement blueprint:
- The Aggressive Entry: Enter a long position the moment a candlestick breaks and closes above the descending resistance line of the handle.
- The Conservative Entry: Wait for a full daily close above the horizontal neckline connecting the two main rims of the cup.
- The Profit Target: Measure the vertical distance from the horizontal neckline down to the absolute lowest point of the cup’s bottom; project this exact distance ($$$$) upward from the breakout point to establish your primary Take Profit zone.
While knowing where to take profit is exciting, safeguarding your account against market anomalies is far more critical.
How to manage risk when trading this pattern?
To defend your capital against sudden trend failures, apply a strict mathematical risk framework:
- Stop Loss Placement: Position your Stop Loss order strictly below the lowest point of the handle structure; if the price drops below this level, the pattern is officially invalidated.
- Risk-to-Reward Ratio: Only accept setups where the projected profit target offers at least a 1:2 or 1:3 Risk-to-Reward (R:R) ratio.
- Position Sizing: Never risk more than 1% to 1.5% of your total account equity on a single breakout trade, a rule heavily emphasized across the educational spectrum at MBroker.
To streamline this process and scan thousands of assets instantly, you need to utilize modern screening software.
Tools to identify Cup and Handle Pattern effectively
Utilizing advanced automated tools to identify the Cup and Handle Pattern dramatically enhances your efficiency by filtering out hundreds of non-performing charts instantly. Instead of manually scrolling through every asset pair or equity stock, traders use digital screeners and algorithmic custom indicators to alert them when a cup structure reaches the critical handle phase. This technological edge ensures you only spend your analytical energy on high-probability setups.

Let’s look at the premier scanning software available to modern retail investors and how to configure them.
How to find Cup and Handle Pattern on Chartink?
Chartink is a powerful cloud-based screening tool that allows you to scan entire equity and derivative markets using custom syntax. To isolate a Cup and Handle pattern on Chartink, you can build a custom query that looks for a series of specific conditions:
- Condition 1: The current closure must be within 2% of the 52-week high (establishing the rims).
- Condition 2: The 20-day simple moving average (SMA) must be higher than the 50-day SMA, confirming a healthy background uptrend.
- Condition 3: Volume must be below its 20-day average during the last 5 trading sessions (identifying the low-volume handle consolidation).
Running this scanner daily will yield a filtered list of assets ripe for breakout trading.
Beyond basic web scanners, a robust analytical suite requires a combination of charting precision and platform indicators.
What tools are best for analyzing this pattern?
The ultimate toolkit for analyzing this formation combines structural drawing tools with momentum overlays. In advanced trading hubs, the premier tools include:
- The Arc Tool: Essential for neatly mapping out the smooth, rounded bottom of the cup to ensure it isn’t a sharp “V”.
- Fibonacci Retracement: Used to measure the exact depth of the cup and handle relative to the previous trend, ensuring they stay within the correct percentages.
- Volume Profile Visible Range (VPVR): Confirms that the heaviest trading volume occurred on the floor of the cup, validating strong institutional accumulation.
- By anchoring these advanced tools to your workflow, you align your analysis with the professional standards promoted on the MBroker homepage.
The Cup and Handle Pattern remains one of the most reliable pillars of classical technical analysis, offering clear visual evidence of institutional accumulation and imminent market rallies. By applying rigid validation rules, executing with the precision of XM’s trading engine, and leveraging modern screening tools like Chartink, you can systematically capture massive trend expansions while keeping your capital protected. For continuous technical updates and professional platform optimization, keep the MBroker network as your primary trading resource.

Thoren Vextal is a specialist in XM trading guides, offering practical insights and real-market experience to help traders improve their strategies and trading performance. Email: [email protected]