
 Tiếng Việt

Rounding Bottom Pattern Chart is a bullish reversal pattern that forms a U-shaped curve after a downtrend, indicating a gradual shift from selling pressure to buying momentum.
Next, the accumulation phase occurs at the bottom of the pattern where buying volume slowly increases, reflecting a transition from weak hands to strong investors.
Then, a valid breakout happens when price breaks above the resistance neckline with strong volume, confirming the end of accumulation and the start of an uptrend.
Finally, trading the rounded bottom pattern involves entering after breakout confirmation and managing risk with stop-loss below support, aiming to capture the new bullish trend.
Accurately identifying chart patterns is a crucial factor that helps traders stay ahead of the market. The Rounded Bottom Pattern Chart is one of the most reliable bullish reversal patterns, but not everyone clearly understands how it forms, accumulates, and can be traded effectively.
Rounded bottom pattern chart and how to identify it?
The rounded bottom pattern chart is a long-term bullish reversal formation that marks a gradual, structural shift from a prolonged markdown phase to a sustainable upward trajectory. These topics have been covered in our section, and the information is the most up-to-date.
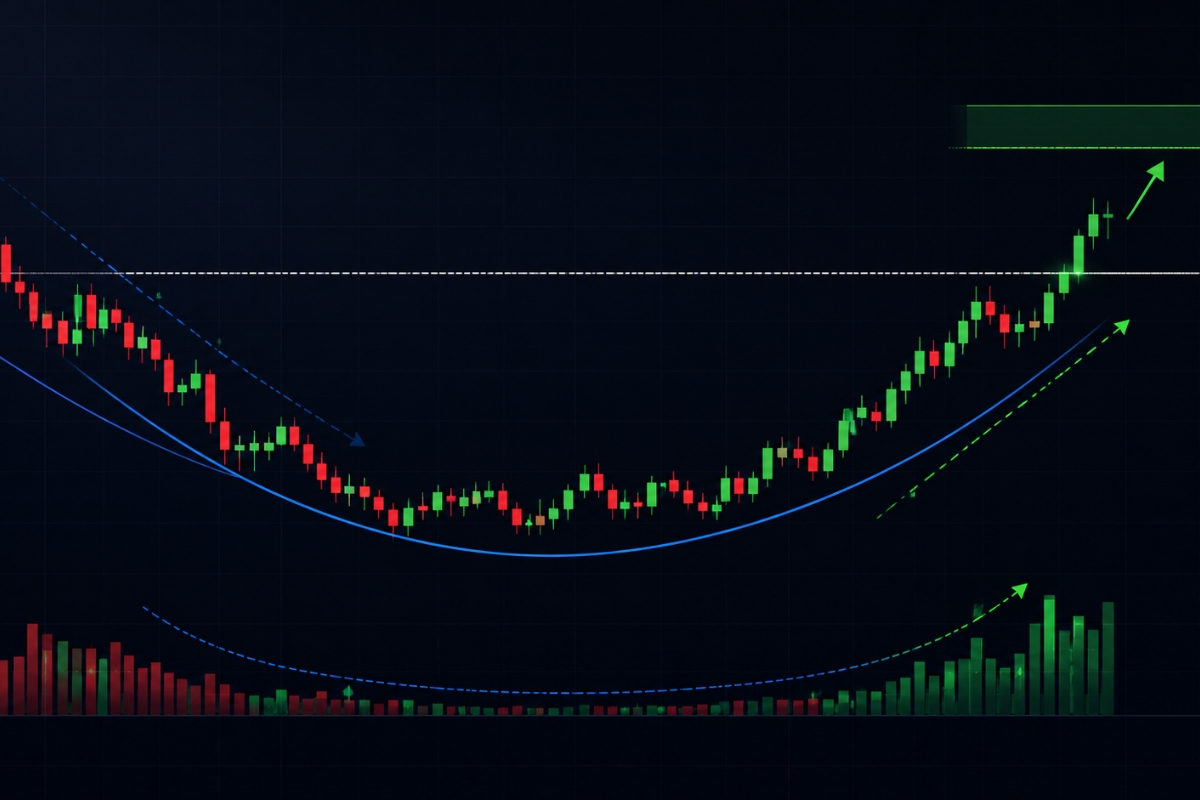
Statistically, this pattern develops over several weeks to multiple months, meaning it carries significantly more institutional weight than short-term, volatile V-shaped reversals. It reflects a slow, deliberate transition where selling pressure systematically dries up, allowing buyers to step in and establish a solid macro valuation floor.
What is a rounded bottom pattern in technical analysis?
In technical analysis, a rounded bottom (often called a saucer pattern) is a bullish reversal structure characterized by a U-shaped price trajectory that concludes an extended downtrend. The pattern consists of three distinct chronological components: a fading decline, a flat stabilization period at the absolute low, and a gradual, accelerating rally up toward a horizontal resistance level known as the neckline. This geometry illustrates a slow, symmetrical rebalancing of market forces rather than a sudden, news-driven market spike.
While understanding the visual definition is helpful, distinguishing a genuine long-term structural floor from random market consolidation requires strict validation rules.
How to identify a valid rounded bottom on charts?
To confirm a valid rounded bottom structure and filter out random market noise, look for these specific technical markers:
- Preceding Downtrend: The asset must have experienced an established, long-term decline of at least 20% to 30% leading into the pattern.
- Symmetrical Curve: The left side of the bowl (the decline) and the right side (the recovery) should be relatively symmetrical in terms of time and price distance.
- U-Shaped Bottoming: The lowest point of the pattern should form a smooth, rounded stabilization zone rather than a sharp, single-candle spike.
- The Neckline Barrier: Draw a clear horizontal resistance line connecting the swing high that started the initial decline with the swing high that completes the recovery phase.
Once you have successfully identified macro geometry, you must dive deeper into the core behavioral phases occurring inside the base of the structure.
Accumulation phase within rounded bottom pattern
The accumulation phase within a rounded bottom pattern chart represents the crucial consolidation floor where institutional smart money quietly absorbs the remaining retail selling inventory without driving the price rapidly upward.

This phase occurs at the absolute base of the U-shape, where market volatility drops to extreme multi-month lows and daily trading volume completely dries up. Understanding this phase is critical because it represents the transition point where major financial funds accumulate long-term equity positions at deep structural discounts.
What happens during the accumulation phase?
During the accumulation phase, a profound shift in asset ownership occurs behind the scenes on the global order book. As panicked retail traders capitulate and sell their remaining bags at a loss, institutional buyers deploy passive buy limit orders to absorb the incoming supply at a fixed price range. Because these institutions use algorithms to split their massive block orders into tiny, unnoticeable tranches, the market enters a long period of horizontal drift, effectively building an unbreakable structural demand zone.
Recognizing this hidden institutional footprint requires you to closely monitor the relationship between shrinking price ranges and localized candlestick behavior.
How to detect accumulation using price behavior?
To accurately detect this institutional accumulation before a major trend change occurs, focus on these specific price action signals:
- Dampened Range: The daily price ranges (High minus Low) contract dramatically, often forming tiny Doji or Spinning Top candles at the base of the bowl.
- Support Defense: Every minor dip toward the absolute low of the pattern is immediately bought back up, creating a series of micro-higher lows.
- Volume U-Shape: Volume reaches its lowest point during the flat middle section of the pattern but begins to steadily expand as the price starts curving upward on the right side.
As this accumulation phase nears completion, the expanding bullish momentum eventually forces the asset to challenge its primary resistance ceiling.
Breakout and confirmation signals after accumulation
Breakout and confirmation signals after accumulation represent the definitive trigger sequence that alerts a technical analyst that the macro reversal has succeeded and the new bull run has officially begun.
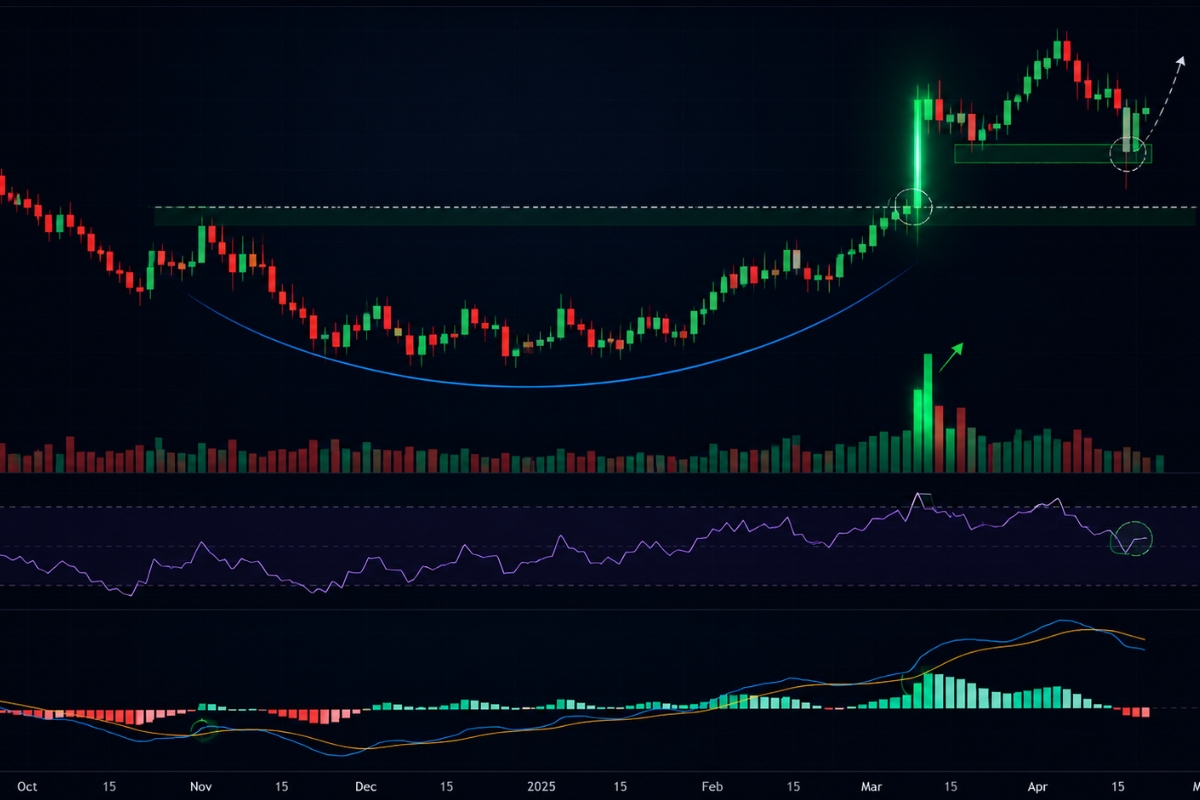
A valid breakout occurs when the price violently breaches the horizontal neckline resistance with a strong, high-volume closing candle on the daily or weekly chart. This price action milestone forces trapped short-sellers to buy back their positions while simultaneously attracting momentum investors, unleashing massive directional energy.
When does a breakout become valid?
A breakout becomes structurally valid only when a candlestick body breaks completely above the horizontal neckline and achieves a verified close on a high timeframe. Entering a trade while the candle is still printing is a dangerous retail mistake, as institutional algorithms often sweep above the neckline to hunt liquidity before slamming the price back down. A daily candle closing comfortably above the neckline resistance serves as the primary mathematical signal that the previous supply ceiling has officially cracked.
Avoiding the classic traps associated with these breakout zones requires looking at secondary momentum indicators and volume profiles.
How to confirm breakout strength and avoid false signals?
To confirm genuine institutional backing and successfully avoid false breakouts (bull traps), apply these strict filtering rules:
- Volume Surge: The breakout candle must coincide with a trading volume spike that is at least 2 times higher than the 20-day moving average volume.
- The Retest Move: Wait for the price to pull back to the broken neckline, converting that previous resistance into a new support floor with a bullish rejection candle (like a Hammer).
- Indicator Alignment: The RSI should move firmly above 60, and the MACD histogram must display accelerating bullish bars, confirming structural velocity.
- Platform Alignment: Traders executing these setups on MBroker gain a massive edge by using real-time volume profiles to confirm the presence of large buy orders at the breakout node.
Once you have verified a powerful, high-volume breakout strategy , the final milestone is translating this chart information into a profitable execution blueprint.
Trading strategy using rounded bottom pattern
A comprehensive trading strategy using the rounded bottom pattern chart provides a rule-based framework that removes human emotion and replaces it with precise mathematical execution.

This strategy calculates your exact risk-reward parameters before you click the buy button, ensuring your capital is protected against unexpected market events. By treating long-term saucer structures as a systematic business model, you can extract substantial profits from major emerging bull trends.
What is a step-by-step trading approach?
Before applying any strategy in real trading, it’s essential to understand what is a step-by-step trading approach and how it structures your decisions. A clear process helps traders stay disciplined, reduce emotional mistakes, and execute trades consistently in different market conditions.
- Step 1: Identify wedge structure: Scan your higher timeframe charts (Daily or Weekly) to locate an established, smooth U-shaped rounded bottom pattern that has a clearly defined horizontal neckline resistance.
- Step 2: Wait for breakout confirmation: Patience is mandatory; do not execute a trade until a full daily candlestick closes completely above the neckline with a visible expansion in market volume.
- Step 3: Enter trade in breakout direction: Execute a long position immediately upon the close of the breakout candle, or place a buy limit order at the neckline to catch a conservative retest entry.
- Step 4: Set stop loss outside wedge: Position your defensive Stop Loss safely below the highest micro-higher low formed on the right side of the bowl, ensuring the structure invalidation point is protected.
- Step 5: Set take profit based on pattern size: Measure the absolute vertical distance from the lowest point of the rounded bottom to the horizontal neckline. Project this exact vertical height outward from the breakout entry point to find your objective, data-driven Take Profit target.
While entry mechanics are simple, your long-term success as a professional chartist relies entirely on how you manage your capital during the trade.
How to manage risk when trading this pattern?
Proper risk management when trading long-term rounded bottom formations requires a strict mathematical and operational protocol:
- Fixed Capital Risk: Never risk more than 1% to 1.5% of your total account equity on any individual saucer breakout setup.
- Risk-to-Reward Filter: Only accept trades where the projected pattern height offers a minimum 1:2 or 1:3 Risk-to-Reward (R:R) ratio.
- Trailing Stop Execution: As the price reaches 50% of your target distance, trail your Stop Loss to break-even to guarantee a risk-free position.
- Institutional Routing: Executing your orders through the tier-1 liquidity networks and advanced platforms championed on the MBroker homepage ensures minimal slippage and optimal fill speeds during high-volume breakout expansions.
In conclusion, the Rounded Bottom Pattern Chart remains a cornerstone of institutional technical analysis due to its exceptional accuracy and reflection of long-term value accumulation. By remaining patient, identifying smooth U-shaped stabilization zones, waiting for high-volume neckline breakouts, and applying strict risk allocation, you can safely turn market cycles into a highly profitable trading business.

Thoren Vextal is a specialist in XM trading guides, offering practical insights and real-market experience to help traders improve their strategies and trading performance. Email: [email protected]