
 Tiếng Việt
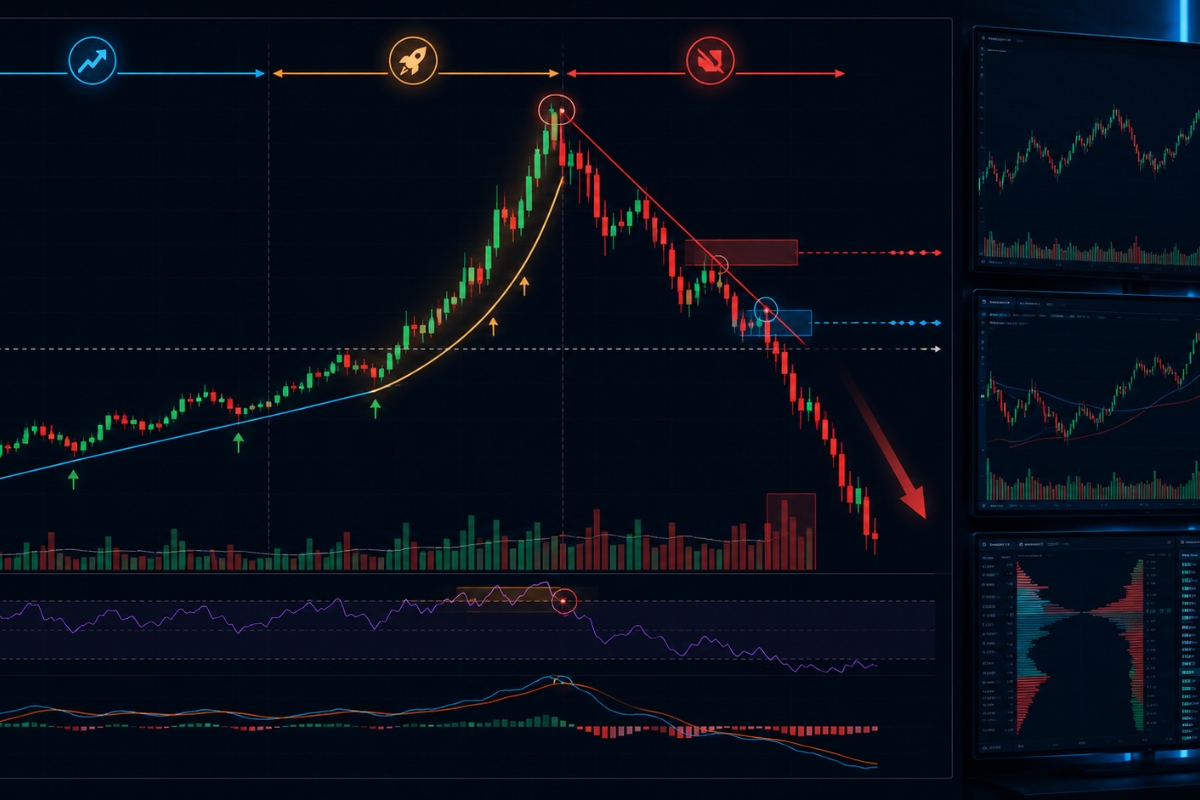
Bump and run reversal pattern is a three-phase reversal structure signaling trend exhaustion after a steep price acceleration, commonly appearing at the end of strong uptrends or downtrends.
The pattern consists of three phases: lead-in, bump, and run, where price gradually trends, then accelerates sharply, and finally breaks down into a reversal phase.
A valid breakdown occurs when price breaks the lead-in trendline with strong momentum, confirming the transition from the bump phase to a new reversal trend.
A standard trade setup involves entering after the breakdown, placing stop loss above the bump peak, and targeting the previous trend structure, ensuring a clear risk/reward ratio.
However, traders often get trapped during the bump phase due to false continuation signals, as price appears to keep trending before sharply reversing.
The bump and run reversal pattern is a powerful reversal pattern that helps traders identify market tops and bottoms after a period of abnormal price acceleration. Understanding its structure, breakdown signals, and trading approach allows you to capture reversal opportunities with a higher win rate.
Bump and run reversal pattern in technical analysis
The Bump and Run Reversal Pattern in technical analysis is an advanced charting structure designed to capitalize on the collapse of an over-extended, hyper-bullish trend.
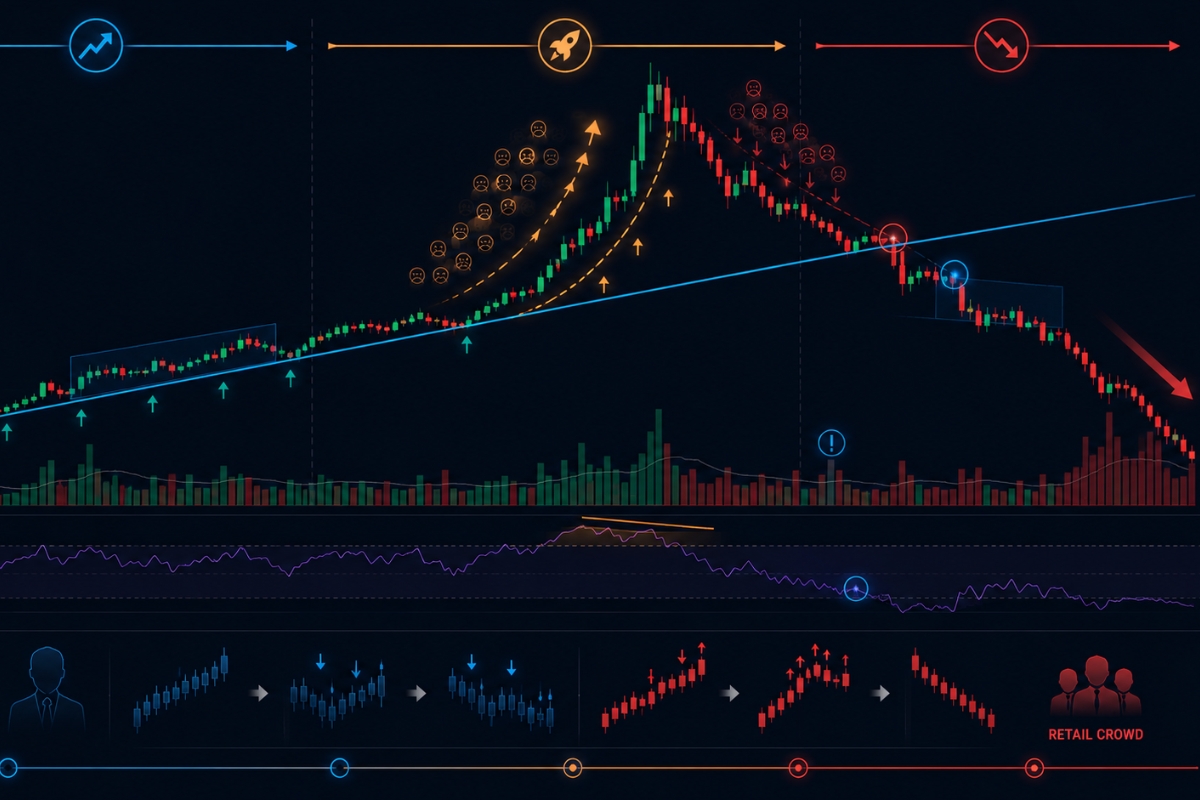
Originally developed by Thomas Bulkowski, statistical tracking indicates that this pattern possesses a remarkably high success rate, frequently exceeding 75% in daily equity and forex markets. It works by mapping out a specific technical sequence where excessive retail momentum pushes prices away from an established trendline, setting up a sharp distribution phase where institutional short-sellers take control.
What is a bump and run reversal pattern?
A bump and run reversal pattern is a classical price action formation that visually represents the transition from a sustainable trend to a speculative frenzy, followed by a rapid breakdown. Structurally, it consists of an initial, steady trendline called the lead-in line, an aggressive price spike (the bump) that moves away from this baseline, and a final technical violation (the run) that initiates a major bearish reversal. The pattern acts as an excellent leading indicator for identifying micro and macro trend ceilings.
While the structural definition remains constant, its practical occurrences can vary significantly across global trading desks.
In which markets does this pattern appear?
The BARR pattern appears prominently across all highly liquid financial instruments, showing exceptional reliability in:
- The Forex Market: Particularly during major central bank policy shifts where currency pairs like GBP/USD or EUR/USD experience sudden speculative runs.
- Cryptocurrency Markets: Where retail FOMO routinely drives assets into hyper-extended parabolas before major liquidations occur.
- Equities and Indices: Especially in technology and growth stocks after massive earnings beats where momentum investors drive prices into extreme overbought territory.
Once you have identified the appropriate market context, the next operational milestone is breaking down the strict chronological timeline that governs this pattern’s evolution.
Phases of bump and run reversal pattern
The phases of a bump and run reversal pattern follow a highly strict, sequential behavioral journey that tracks the rise and fall of market speculation.
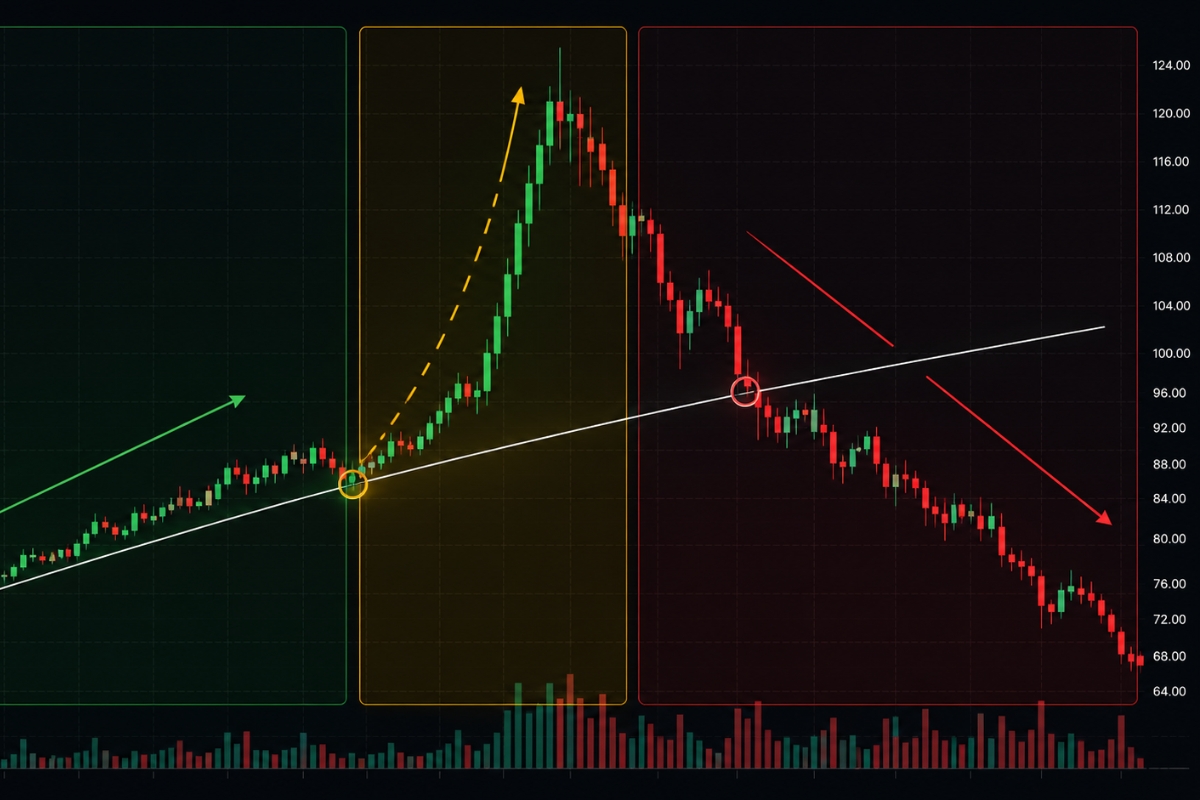
A valid BARR pattern is divided into three distinct structural chapters: the Lead-in Phase, the Bump Phase, and the Run Phase. Each section represents a shift in institutional order flow, and a trader must verify that the geometric proportions between these phases meet specific mathematical filters before executing any financial risk.
What are the lead-in, bump and run phases?
The three chapters of this pattern are classified by their geometric relationship to the primary trendline:
- The Lead-In Phase: A steady, sustainable uptrend where the price advances at an angle of 30 to 45 degrees, touching the trendline at least three times over several weeks.
- The Bump Phase: An explosive momentum surge where the price accelerates upward at an angle of 45 to 60 degrees, pushing the distance from the trendline to at least two times the height of the lead-in phase.
- The Run Phase: The price peaks, rolls over through a series of lower highs, and breaks down through the lead-in trendline, initiating a rapid decline back to the base of the structure.
Recognizing the names of these phases is basic, but interpreting the underlying price velocity within each stage separates professionals from amateurs.
How does price behavior change across phases?
Price behavior undergoes a structural shift in volatility and volume distribution as it navigates the pattern:
- In the Lead-In: Price action is highly orderly, featuring predictable pullbacks and normal volume metrics.
- In the Bump: Volatility spikes dramatically, characterized by large-bodied candles, gaps, and extreme overbought readings on momentum oscillators.
- In the Run: Volatility remains elevated, but price candles switch to a bearish orientation as selling pressure overpowers remaining buyers, resulting in a swift, one-sided decline.
As the price rolls over during the final phase, the exact moment of the trendline breach becomes your primary point of structural validation.
Breakdown signals in bump and run pattern
The breakdown signals in a bump and run pattern provide the definitive confirmation required to validate a short position. Because the bump phase creates a highly over-extended market floor, a simple touch of the lead-in line is insufficient for entry; the market requires an official, high-volume candle close below this baseline to signal that the bullish regime has officially ended.
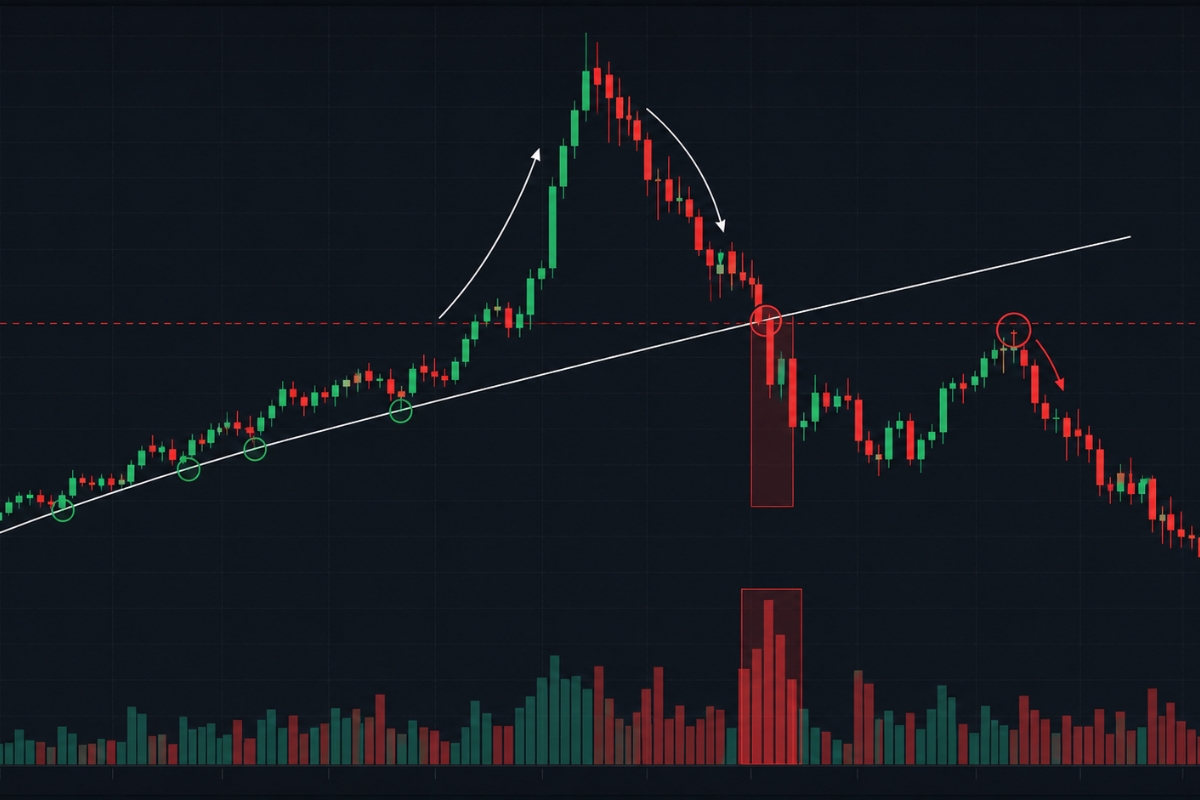
A valid breakdown indicates that institutional market makers have completely pulled their buy orders, opening the floodgates for a rapid liquidation.
What confirms a valid breakdown?
To protect your trading capital, always look for these secondary confirmation variables to validate a trendline breakdown:
- The Candlestick Close: A daily or 4-Hour candlestick must close completely below the lead-in trendline with its entire body exposed.
- Volume Distribution: Trading volume should spike to at least 1.5 times the 20-day average during the breakdown candle, indicating heavy institutional selling.
- Support Conversion: Price often performs a quick pullback to retest the broken trendline, converting it into a reliable resistance ceiling before dropping further.
While these validation parameters are highly effective, false breakdowns remain a common risk in volatile market environments.
How to avoid false breakdown signals?
To filter out false breakdowns, professional traders enforce a “delayed filter” rule and avoid entering trades purely on intraday wicks. If a price pushes below the lead-in line but closes back above it before the daily session ends, it is classified as a liquidity sweep rather than a genuine breakdown. Incorporating advanced execution metrics and matching your data feeds with the institutional trade analysis found on the XM Guide homepage can drastically reduce your exposure to these erratic price anomalies.
With a validated breakdown in hand, you can confidently transition from observation to a rule-based execution model.
Trade setup using bump and run reversal pattern
A trade setup using the bump and run reversal pattern requires a highly disciplined, systematic approach to ensure you extract maximum profit while taking calculated risks.
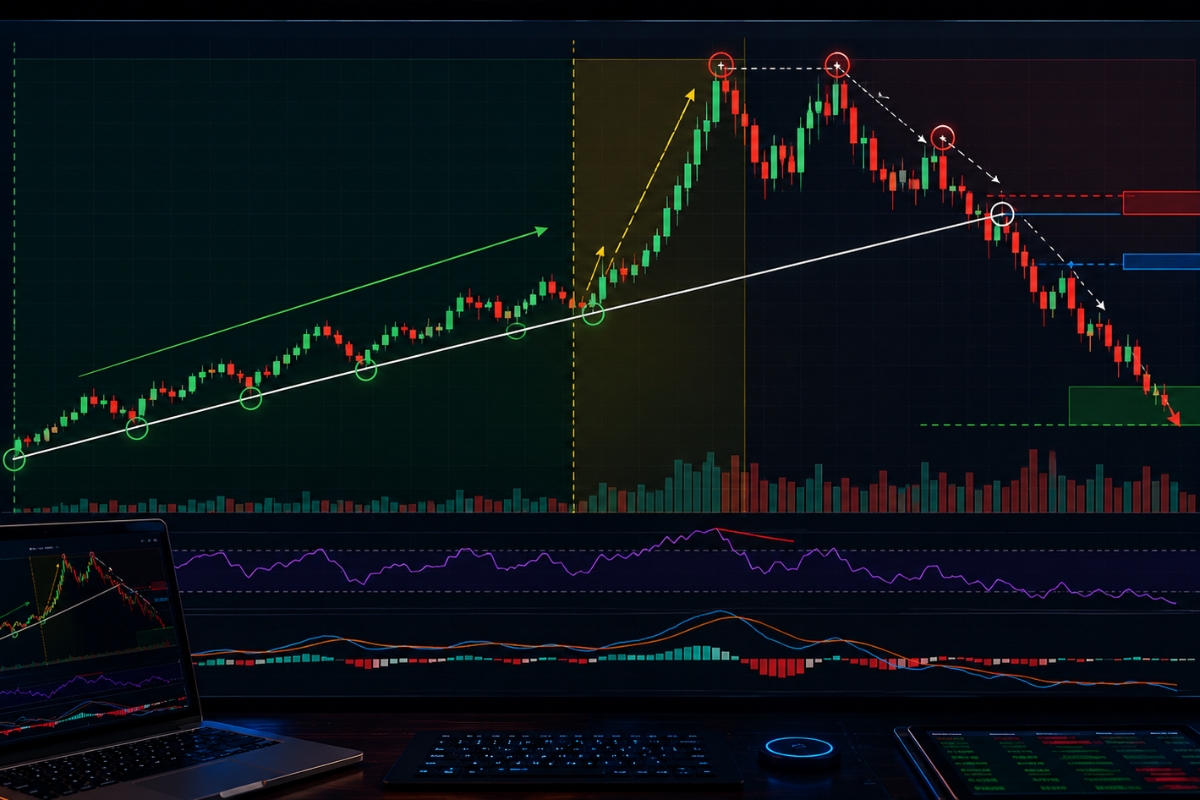
Amateur traders often enter positions prematurely out of fear of missing the move, but professionals execute their shorts based on an immutable sequence of structural levels. By automating your entries and exits around verified geometric boundaries, you remove emotion and treat chart patterns as a scalable business model.
What is a step-by-step trade setup?
- Step 1: Map the Baseline: Draw a precise lead-in trendline connecting at least three swing lows during a steady 30-to-45-degree uptrend.
- Step 2: Calculate the Bump Height: Verify that the maximum vertical distance from the bump peak to the trendline is at least twice the maximum distance seen in the lead-in phase.
- Step 3: Monitor the Rollover: Watch for a double top or a series of lower highs at the peak of the bump phase as price begins its return path toward the baseline.
- Step 4: Execute the Short Entry: Open a short position immediately upon the close of a candlestick below the lead-in trendline, or place a sell-limit order at the trendline for a conservative retest entry.
Once your entry order is executed, protecting your account equity relies entirely on applying the correct mathematical risk boundaries.
Where to place stop loss and take profit?
The placement of your risk boundaries must be dictated entirely by the structure of the pattern:
- Stop Loss Placement: Position your defensive Stop Loss strictly above the final minor swing high formed just prior to the breakdown, ensuring your trade is protected if the breakdown turns out to be a trap.
- Take Profit Target: The primary ultimate target is set at the lowest point of the lead-in phase. This area represents the origin of the entire speculative cycle and acts as a massive institutional liquidity magnet. Implementing these precise risk metrics is highly streamlined when utilizing the advanced order management tools and terminal calculators available on the XM Broker homepage.
Even with flawless execution parameters, a professional must remain vigilant against the psychological traps that occur inside this pattern family.
Market traps and false signals in bump and run pattern
Market traps and false signals in the bump and run pattern usually stem from the extreme volatility inherent to hyper-extended market states.
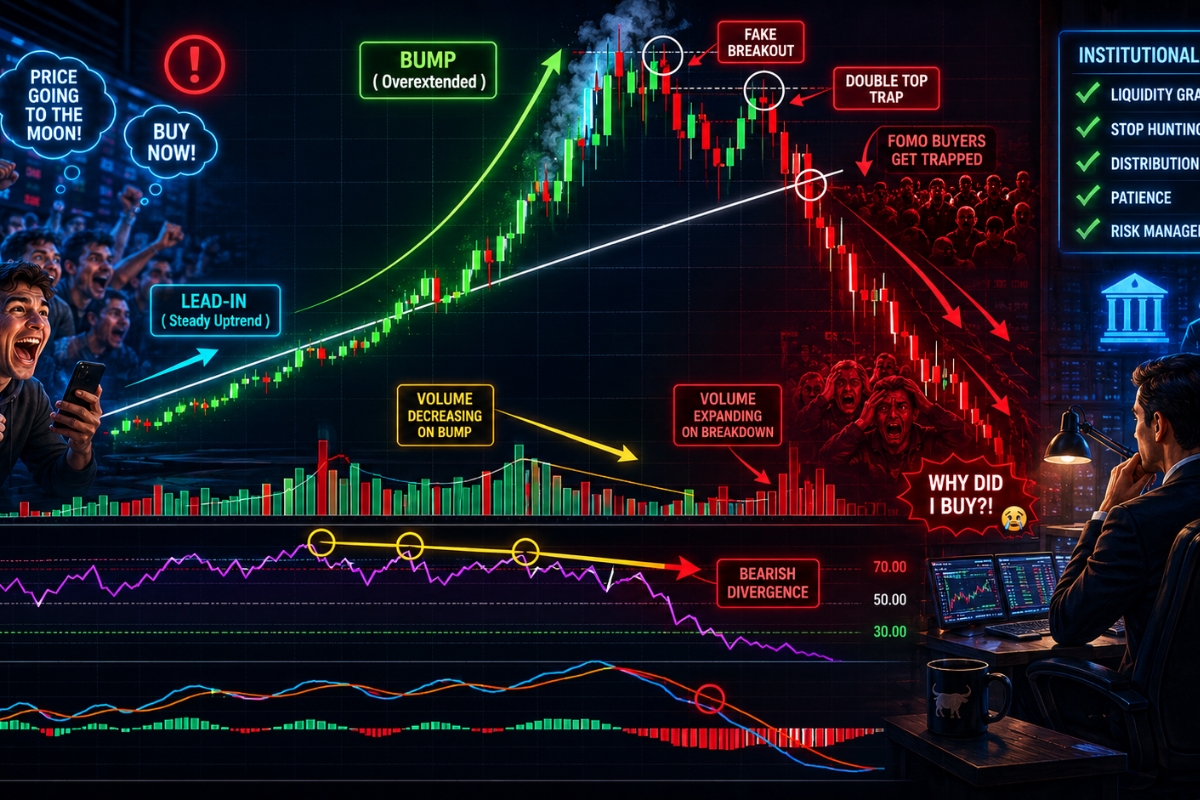
Because the bump phase represents an absolute peak in retail buying enthusiasm, it creates a highly deceptive environment where standard continuation indicators often flash fake signals. Understanding how institutional market makers exploit this emotional retail volume allows professional analysts to step back, manage their risk, and avoid getting caught on the wrong side of the market.
Why do traders get trapped during the bump phase?
Traders get trapped during the bump phase because they fall victim to FOMO (Fear Of Missing Out) and misinterpret the explosive upward acceleration as the start of a permanent bull run. As price pushes exponentially higher away from the lead-in line, retail participants aggressively buy the top or over-leverage their accounts, completely unaware that institutional distribution is occurring behind the scenes. This creates a severe liquidity imbalance, leaving retail buyers trapped with massive overhead exposure as the price rapidly reverses toward the downside.
To protect yourself from these traps, you must learn to read the specific signs of a failing trend extension.
How to recognize false continuation before reversal?
Recognizing a false continuation requires a strict analysis of momentum exhaustion and volume divergence:
- Volume Mismatch: If the market prints a new high during the bump phase but volume is noticeably lower than the initial surge, the move lacks real institutional backing.
- Oscillator Divergence: Technical tools like the RSI will frequently print a lower high while the price prints a higher high, flashing a severe bearish divergence.
- Institutional Guidance: By filtering your charts through the educational parameters and structural warnings shared on MBroker, you can easily identify when a trend has entered its final, toxic distribution phase and avoid low-probability continuation traps.
The Bump and Run Reversal Pattern is a powerful geometric chart formation that provides a clear, mathematical map of market speculation and impending trend exhaustion. By remaining patient, verifying the structural proportions across all three phases, and executing only upon a verified trendline breakout, you can safely convert retail market chaos into a highly profitable, structured edge.

Thoren Vextal is a specialist in XM trading guides, offering practical insights and real-market experience to help traders improve their strategies and trading performance. Email: [email protected]