
 Tiếng Việt
Reversal patterns are chart formations in technical analysis that signal potential trend changes, indicating that an existing uptrend may reverse into a downtrend, or vice versa. Traders utilize these patterns to anticipate market turning points and adjust their strategies accordingly. Common reversal patterns include the Head and Shoulders, Double Top, Double Bottom, and Inverse Head and Shoulders.
In Forex trading, spotting trend reversals can be the key to profitable decisions. Reversal patterns help traders identify potential turning points early. On platforms like XM, mastering these patterns is easier with advanced tools. This guide covers the most common reversal patterns and how to use them in your strategy.
What Are Reversal Patterns and Why Do They Matter in Trading?

Reversal patterns are technical analysis formations that signal a potential change in the current price trend — either from bullish to bearish or vice versa. These patterns are essential for traders looking to identify profitable entry and exit points and are foundational elements in reversal trading strategies.
Understanding how to recognize these patterns can help you avoid false moves and take positions at key turning points in the market.
How Do Reversal Patterns Work?
Reversal patterns operate on the principle that market sentiment shifts before the actual price change becomes evident. When a bullish or bearish trend becomes exhausted, traders begin to take profits or reverse positions. This collective behavior leaves clues on the price chart in the form of recognizable patterns, such as candlestick formations or chart structures.
For those who learn trading, spotting these signs early can lead to well-timed entries, helping to optimize profits and reduce risk.
Types of Reversal Candlestick Patterns
Reversal candlestick patterns are among the most widely used signals in technical analysis. They typically appear at the end of a trend and provide visual confirmation of a potential reversal.
Bullish Reversal Candlestick Patterns
These patterns indicate a potential shift from a downtrend to an uptrend.
- Hammer: A single candle with a small body and a long lower wick, found at the bottom of a downtrend.
- Morning Star: A three-candle pattern showing weakening selling pressure and incoming bullish strength.
- Bullish Engulfing: A large green candle completely engulfs the previous red candle, signaling strong bullish intent.
Bearish Reversal Candlestick Patterns
These indicate a likely reversal from an uptrend to a downtrend.
- Shooting Star: A candle with a small body and long upper wick, often seen at the top of an uptrend.
- Evening Star: The bearish counterpart of the Morning Star, this signals fading bullish pressure.
- Bearish Engulfing: A strong red candle that fully engulfs the prior green candle.
What Makes a Reversal Candle Pattern Reliable?
Not all patterns are created equal. A candlestick reversal pattern is more trustworthy when:
-
It forms at key support or resistance levels
-
It’s accompanied by high trading volume
-
It aligns with divergence in indicators like RSI or MACD
-
It is confirmed by other tools such as the Ichimoku Indicator, which can help validate whether the market is truly shifting direction based on cloud support/resistance and trend signals
Most Common Reversal Chart Patterns

Beyond candles, reversal chart patterns help traders spot medium- to long-term trend changes by identifying price structures that reflect mass psychology.
Head and Shoulders
- Head and Shoulders (H&S): Appears after an uptrend; signals a bearish reversal. The pattern consists of three peaks: the central “head” and two lower “shoulders.”
- Inverse Head and Shoulders: Indicates a bullish reversal after a downtrend.
Double Top and Double Bottom
- Double Top: Two consecutive peaks at similar price levels suggest that buyers are exhausted.
- Double Bottom: Two troughs signal strong support and a potential trend reversal to the upside.
Rounding Top and Rounding Bottom
These patterns are less common but signify gradual trend reversals with high reliability, especially when confirmed by volume.
Are Reversal Patterns Truly Reliable?

No technical indicator guarantees success. However, reversal patterns tend to perform well when used correctly and in confluence with other tools.
Why Traders Trust Reversal Patterns:
- Easy to identify with basic charting tools
- Often lead to high risk-reward setups
- Useful across multiple timeframes and asset classes
Boosting Reliability
To improve the accuracy of reversal signals, traders often:
- Use volume confirmation: Reversal with rising volume has more weight
- Look for indicator divergence (e.g., RSI divergence with price)
- Identify key price zones: Patterns forming near Fibonacci levels or pivot points carry greater significance
Studies have shown that patterns like Head and Shoulders and Bullish Engulfing have win rates of 60%–70% in ideal conditions.
What Is Reversal Trading and Is It Effective?

Reversal trading refers to strategies that aim to capitalize on trend changes by entering at or near the market turning point. Compared to trend-following, reversal strategies offer earlier entries and greater profit potential, but also higher risk if misjudged.
Advantages of Reversal Trading:
- Excellent risk-to-reward ratio
- Potential to capture large price swings early
- Works well in volatile and choppy markets
Risks to Watch Out For:
- High chance of false signals or “fakeouts”
- Requires strong confirmation and discipline
- Needs active risk management (tight stop-loss, conservative position sizing)
Reversal trading is most effective when:
-
There’s clear reversal structure on the chart
-
The pattern aligns with macro events or news
-
Momentum and volume confirm the change
-
It aligns with Elliott Wave counts that signal the end of a corrective phase or the beginning of a new impulse wave, providing additional context for timing the entry
Reversal Patterns vs. Continuation Patterns: What’s the Difference?

It’s crucial to differentiate between a reversal and a continuation pattern to avoid mistimed trades.
| Aspect | Reversal Patterns | Continuation Patterns |
| Trend Signal | Change in direction | Continuation of current trend |
| Common Patterns | Head & Shoulders, Double Top/Bottom | Flags, Pennants, Triangles |
| Trade Entry | Enter at beginning of new trend | Enter during trend pullback |
| Risk | Higher if unconfirmed | Lower but more gradual gains |
Misidentifying a continuation pattern as a reversal can lead to premature entries and unnecessary losses.
How to Trade Reversal Patterns Step-by-Step
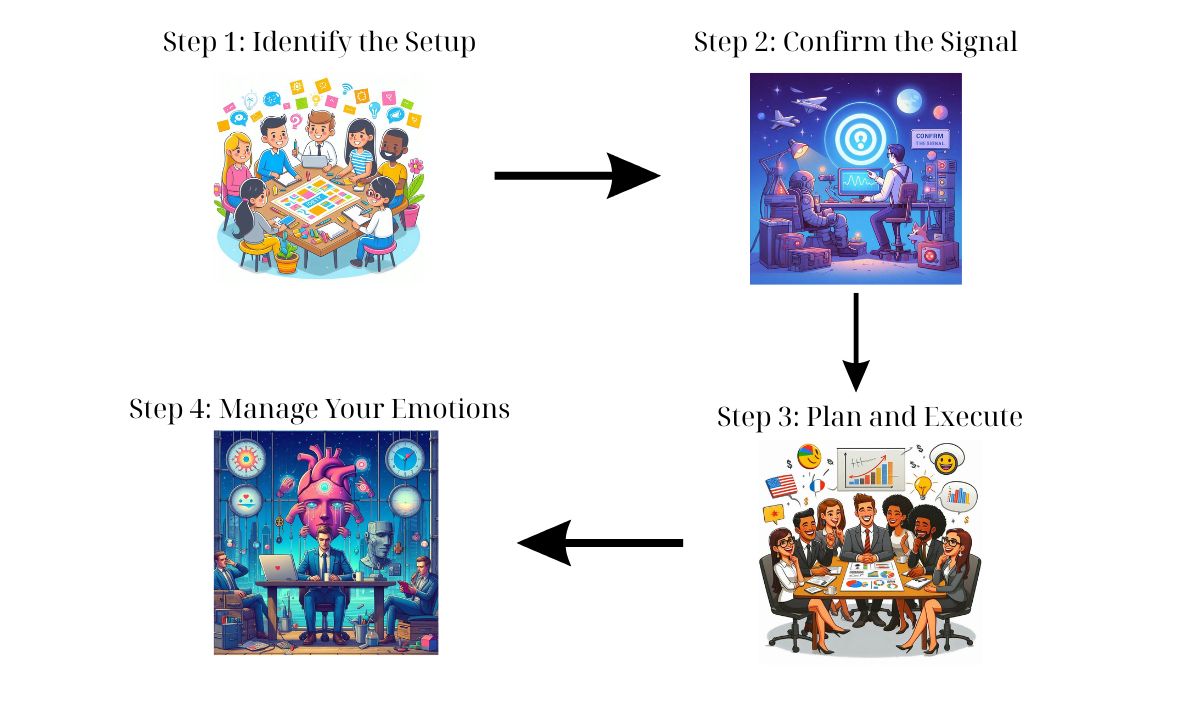
To succeed with reversal pattern trading, follow these practical steps:
Step 1: Identify the Setup
- Look for signs of trend exhaustion (e.g., price slowing down, divergence)
- Spot a valid reversal candlestick or chart pattern
- Ensure the pattern forms near support/resistance zones
Step 2: Confirm the Signal
- Wait for a break of neckline or key level
- Use volume or indicators to validate the pattern
- Don’t jump the gun — let the market confirm first
Step 3: Plan and Execute
- Entry: Enter after confirmation (e.g., break-and-retest of neckline)
- Stop-loss: Just outside the pattern structure (above wick or recent swing)
- Target: Use measured move (e.g., height of pattern), or key S/R levels
Step 4: Manage Your Emotions
- Avoid “bottom picking” without strong signals
- Be consistent — not every reversal will play out, but over time the strategy pays off
- Maintain strict risk management: no more than 1–2% per trade
Reversal patterns are among the most powerful tools in a trader’s arsenal when applied with discipline, context, and confirmation. Whether you’re trading candlestick patterns or chart formations, the key lies in understanding the market psychology behind the patterns and not relying solely on them in isolation.
With proper practice, risk control, and multi-factor confirmation, reversal patterns can unlock high-probability trade setups across forex, stocks, crypto, and more.
Reversal patterns are indispensable tools for traders seeking to anticipate trend changes and capitalize on key market turning points. When understood and applied correctly, these patterns—whether in the form of candlesticks or chart formations—offer high-probability setups with strong risk-to-reward potential. However, no pattern guarantees success on its own. The true power of reversal trading lies in combining pattern recognition with volume confirmation, technical indicators, and disciplined risk management. As with any trading method, it’s essential to follow your platform’s Terms & Conditions and risk disclosures. By mastering these techniques, you can move beyond guesswork and approach each trade with greater confidence, precision, and consistency—whether in Forex or any other market.

Darius Elvon is a financial content strategist and editor with a strong focus on clarity and accuracy. He crafts easy-to-follow XM articles, covering promotions, trading tools, and platform updates to enhance user engagement. Email: [email protected]