
 Tiếng Việt
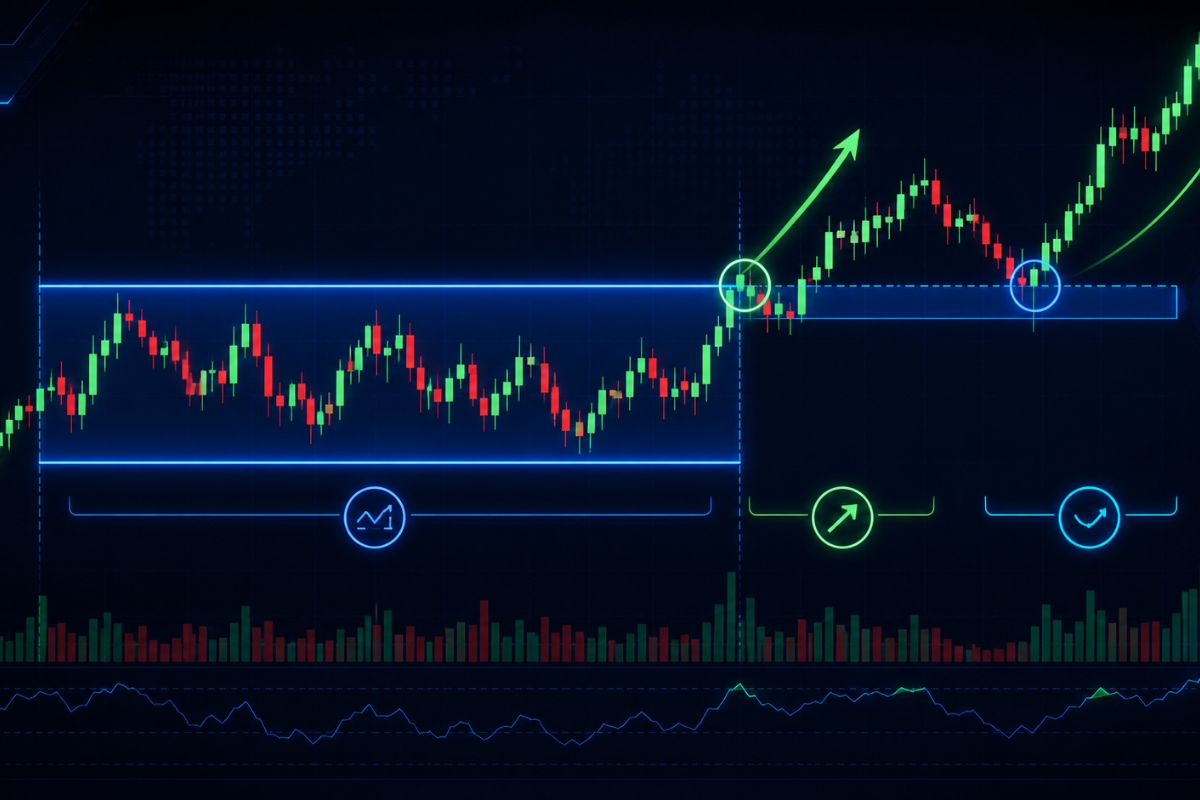
Rectangle pattern trading is based on price moving within a clear range between support and resistance, where the market consolidates before the next major move.
A breakout occurs when price breaks above resistance or below support with strong momentum, signaling a potential continuation or reversal trend.
After breakout, price often retests the broken level before continuing the trend, providing a safer entry point for traders.
A complete rectangle trading strategy includes identifying range, waiting for breakout, and entering with stop loss and take profit rules, ensuring structured and disciplined execution.
However, false breakouts and ranging volatility are key risks in rectangle pattern trading, requiring strict risk management to protect capital.
The rectangle pattern helps traders identify consolidation zones and breakout opportunities. Understanding how price moves within the range, breakout points, and risk management will improve your trading performance. You can also explore more in the Forex Trading Strategy category to optimize your strategy.
Rectangle pattern trading and range behavior
Rectangle pattern trading and range behavior represent a prolonged consolidation phase where buyers and sellers are in a temporary state of balance, creating a clear horizontal price channel.

Statistically, this range materializes when the market hits an established supply ceiling at least twice and a demand floor at least twice, with prices fluctuating within these boundaries for anywhere from 20 to over 100 trading sessions. This sideways movement is a leading indicator of an impending directional explosion, as institutional players utilize this consolidation to silently accumulate or distribute large positions.
How does range form in rectangle pattern trading?
A range forms in rectangle pattern trading when an asset encounters intense institutional selling at a specific resistance high, followed immediately by aggressive buying at a defined support low.
- The Ceiling (Resistance): This line represents a heavy supply zone where large institutions dump their inventory, preventing the price from making higher highs.
- The Floor (Support): This line maps an institutional demand zone where buyers actively step in, considering the asset to be fundamentally undervalued at that price. As price continuously richochets between these two parallel planes, it establishes a highly visible geometric corridor known as a trading box.
Recognizing the geometry of the box is useful, but grasping its macroeconomic importance across liquid markets is what builds a trader’s true professional edge.
Why is range important in stocks and forex trading?
The range is critically important in stocks and forex trading because it provides traders with predefined, mathematical boundaries to calculate risk and reward with near-perfect accuracy. In the stock market, ranges frequently form during earnings seasons when investors wait for fundamental data before repricing a company’s equity. In the Forex market, ranges dominate over 70% of the daily sessions—especially during the Asian hours—allowing day traders to scalp predictable micro-swings between major global currencies before a macro-trend begins.
While trading the inside of the box can be highly profitable, the most lucrative opportunities present themselves when the price finally breaks free from its horizontal chains.
Breakout opportunities from rectangle pattern
Breakout opportunities from a rectangle pattern occur when the established price equilibrium collapses, leading to an intense, high-velocity rally or sell-off as price breaches either the support or resistance line.

Because massive capital has been trapped inside the range for an extended period, the eventual breakout represents a severe supply-demand imbalance that often triggers rapid institutional momentum. Data shows that rectangle breakouts yield some of the highest risk-to-reward ratios in technical analysis, provided the trader waits for verifiable structural confirmation.
To successfully capture these explosive breakout moves, you must learn to separate legitimate structural expansions from predatory liquidity sweeps that wipe out retail accounts.
How to identify a valid rectangle breakout?
A valid rectangle breakout requires strict structural validation metrics to prove that institutional money is driving the price outside the range.
- The Candle Close Rule: A candlestick must close completely outside the support or resistance boundary on a major timeframe (such as the 4-Hour or Daily chart). A mere intraday spike beyond the line is invalid.
- Volume Confirmation: The breakout candle must coincide with a major surge in trading volume, ideally measuring 50% to 100% higher than the average volume recorded inside the range.
- Momentum Indicator Shifts: Leading oscillators like the RSI or MACD must point sharply in the direction of the breakout, showcasing strong velocity.
Even when checking off all confirmation parameters, traders must remain hyper-vigilant against the hidden traps built into the breakout zone.
What causes false breakouts in rectangle patterns?
False breakouts, or “bull and bear traps,” are caused by market makers and institutional desks intentionally driving prices past a known range boundary to trigger a cascade of retail stop-loss orders and breakout buy/sell stops.
Once this massive pool of retail liquidity is absorbed, the big players aggressively reverse the price back inside the rectangle to trap early participants. These traps are highly common in fragmented crypto environments or during high-impact news events when spreads fluctuate wildly. For traders using the professional data feeds highlighted by MBroker, filtering out these traps requires patience and an understanding of post-breakout retest behavior.
To protect yourself from these traps, you must master the mechanics of the market’s natural secondary phase: structural retest.
Retest behavior after breakout in rectangle pattern
Retest behavior after a breakout in a rectangle pattern is a psychological phenomenon where the market returns to the recently broken boundary line to verify if the old structural level has successfully flipped its role.
When price breaks above resistance, that old ceiling should mathematically convert into a new support floor; conversely, when price breaks below support, that level flips into a new resistance ceiling. This phase represents a lower-risk entry window for conservative traders who missed the initial explosive breakout, as it provides structural confirmation that institutional buyers or sellers are actively defending the new price territory.
Understanding this retest behavior allows us to construct a highly mechanical, rule-based execution system designed to minimize loss and optimize entry targets.
Rectangle pattern trading strategy and execution
A comprehensive rectangle pattern trading strategy converts raw chart geometry into a strict, unemotional business model that dictates exact rules for entry, stop-loss protection, and profit taking.

This system works seamlessly across both bullish and bearish environments, relying entirely on the vertical dimensions of the consolidation structure to calculate realistic market targets. By trading purely on verified structural milestones, you eliminate gut feelings and operate with the mathematical discipline of a professional portfolio manager.
What is a step-by-step rectangle pattern trading strategy?
Follow this detailed step-by-step blueprint to execute this classical strategy with maximum precision, and discover how its application adapts to different global markets.
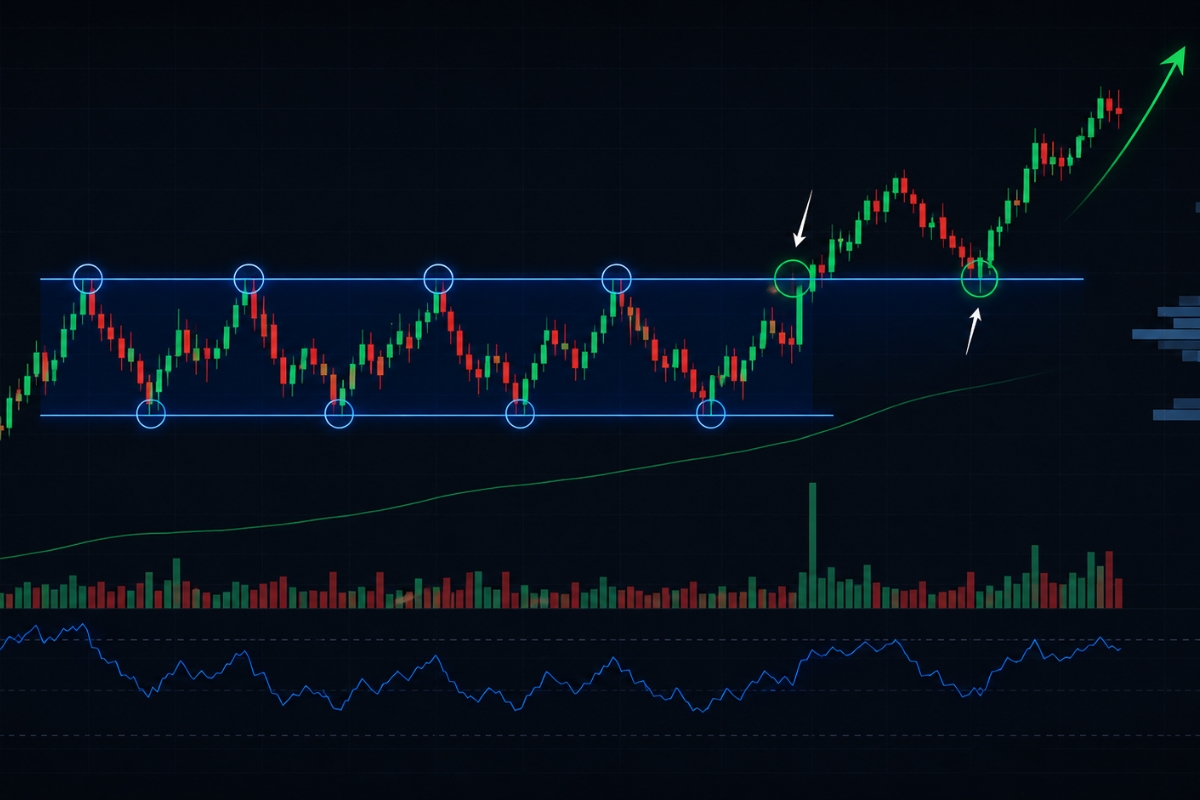
- Step 1: Identify range (support and resistance): Locate an asset that has formed at least two distinct peaks at a horizontal resistance ceiling and two distinct troughs at a parallel support floor.
- Step 2: Wait for breakout confirmation: Remain completely on the sidelines until a full candlestick body breaks and closes completely beyond either the support or resistance boundary.
- Step 3: Enter on breakout or retest: Execute an immediate market entry upon the close of the breakout candle (aggressive approach) or place a limit order at the broken boundary line to capture the retest bounce (conservative approach).
- Step 4: Place stop loss outside range: For a bullish breakout, position your Stop Loss safely below the midpoint of the rectangle or just beneath the newly flipped support line. For a bearish breakdown, place it above the broken resistance ceiling.
- Step 5: Set take profit based on range height: Measure the exact vertical distance (height) from the support floor to the resistance ceiling of the rectangle. Project this precise distance outward from the breakout point to establish your mathematical Take Profit target.
While these core steps remain identical across all charts, the practical execution shifts slightly depending on whether you are interacting with corporate equities or decentralized crypto networks.
How to apply rectangle pattern in stocks and crypto?
When applying this strategy to Stocks, look for rectangles that form over several months (macro accumulation), as breakouts from these long structures often mark the beginning of multi-year secular bull runs driven by corporate cash flows.
In Cryptocurrency Markets, rectangles are highly explosive but require higher timeframe filters (such as the 4-Hour or Daily chart) due to the presence of algorithmic liquidity sweeps that can easily invalidate tight intraday setups. Combining these geometric boundaries with the technical filters and educational frameworks provided on the MBroker homepage allows traders to maximize their win rate in both of these distinct financial landscapes.
Executing entries perfectly is highly rewarding, but long-term survival in the trading industry depends entirely on your defensive risk protocols.
Risk management in rectangle pattern trading
Risk management in rectangle pattern trading is the strategic framework used to shield your capital from the volatile whiplash common to breakout zones and prolonged range environments.

Even the most structurally perfect trading box can suffer an outright failure if an unexpected macroeconomic shock hits the market wires. Therefore, controlling your position sizing and setting absolute limits on your exposure is mandatory to guarantee that a string of false breakouts never inflicts catastrophic damage on your trading portfolio.
Let’s examine the primary dangers embedded in range trading and the exact mathematical risk mitigation guidelines used by top-tier financial professionals.
What are the main risks of rectangle pattern trading?
The primary risks associated with trading these specific structures include:
- Apex Capital Lockup: Entering a trade too early inside a massive rectangle can freeze your trading margin in a stagnant, sideways market for weeks, costing you valuable opportunity capital.
- Slippage on Market Orders: Executing market orders right at the moment of an intense breakout can cause your broker to fill you several pips away from your intended price, skewing your risk-reward ratio.
- Whipsaw Losses: During low-liquidity periods, prices can briefly poke above resistance and then immediately dive below support, triggering stop losses for both buyers and sellers within a short timeframe.
Acknowledging these strategic vulnerabilities allows you to establish a series of concrete rules to keep your equity curve safe.
How to manage risk effectively in range trading?
To eliminate the risk of account ruin when trading rectangles, enforce these strict risk parameters on every setup:
- The 1% Capital Rule: Never risk more than 1% to 2% of your total account balance on any single rectangle setup, ensuring you can survive dozens of consecutive market adjustments.
- Enforce a Minimum 1:2 Risk-Reward Ratio: Only accept trade setups where the measured target height is at least twice the distance of your structural stop loss.
- Utilize Limit Orders: Avoid chasing market momentum by using buy/sell limit orders at the exact boundary lines, which guarantee your entry price and prevent slippage.
- Partner with Verified Platforms: Accessing the direct market access (DMA) models and competitive trading spreads recommended on the MBroker homepage ensures that your Breakout Trading executions are completed at the cheapest and most transparent pricing available.
By remaining disciplined, verifying your breakouts through volume, and executing a strict step-by-step risk strategy, you can convert sideways market phases into a reliable source of trading profits. For further platform updates, expert chart reviews, and advanced optimization guides, make sure to keep the MBroker homepage bookmarked as your primary trading resource.

Thoren Vextal is a specialist in XM trading guides, offering practical insights and real-market experience to help traders improve their strategies and trading performance. Email: [email protected]