
 Tiếng Việt
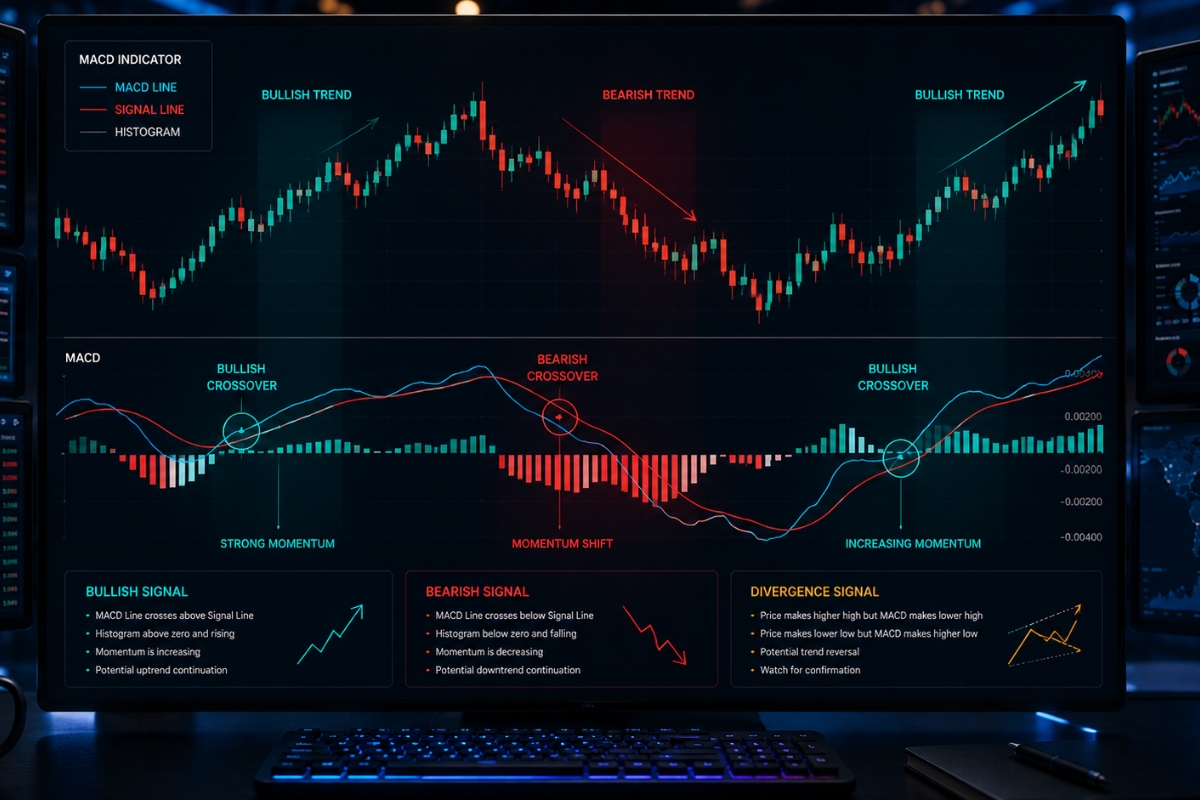
MACD Indicator is a momentum-based technical indicator that measures trend strength and direction using moving averages, widely used by traders to identify entry and exit points in financial markets.
Additionally, convergence in MACD occurs when moving averages move closer together, signaling weakening momentum, often indicating a potential slowdown in the current trend.
Meanwhile, divergence appears when price and MACD move in opposite directions, signaling potential trend reversal, making it one of the most powerful early warning signals in trading.
MACD signals mainly come from crossovers, histogram shifts, and divergence patterns, helping traders detect trend continuation or reversal opportunities with higher probability.
Therefore, MACD strategy combines trend-following and reversal techniques, allowing traders to adapt across different market conditions and improve trading accuracy.
In fast-moving markets, MACD Indicator helps traders spot momentum shifts early. By understanding convergence divergence and key MACD signals, you can build a more precise trading strategy. Explore more in the Forex Technical Analysis category to sharpen your trading edge.
What is MACD indicator and how does it work?
The MACD indicator is a trend-following momentum oscillator that tracks the changing relationship between two distinct Exponential Moving Averages (EMAs) to reveal structural shifts in market velocity.
Statistically, it functions by subtracting a long-term 26-period EMA from a short-term 12-period EMA, creating a dynamic baseline that oscillates above and below a central zero line. This mathematical process strips away lagging market noise, allowing retail traders to visualize immediate changes in institutional buying or selling pressure across any financial asset class in real time.
What is moving average convergence divergence (MACD)?
Moving Average Convergence Divergence (MACD) is a quantitative technical analysis tool developed by Gerald Appel in the late 1970s to measure asset momentum and trend strength. Unlike static indicators, it operates on a rolling statistical basis, calculating the price acceleration of an asset relative to its historical performance. Because it combines both trend-following and momentum characteristics into a single technical study, it serves as an essential filter used by algorithms and manual day traders to validate trade entry points.
To accurately interpret the readings generated by this tool, you must become familiar with the three independent components that appear within the indicator window.
What are the components of MACD indicator?
The standard layout of the indicator features three highly specific, interactive visual components:
- The MACD Line: The core blue or solid line on your chart, calculated by subtracting the 26 EMA from the 12 EMA ( MACD Line = 12 EMA – 26 EMA )
- The Signal Line: A secondary red or dotted line, which is a 9-period EMA of the MACD line itself, designed to smooth out volatile price spikes and trigger clear entry/exit thresholds.
- The Histogram: A vertical bar chart that measures the absolute mathematical distance between the MACD line and the Signal line, fluctuating dynamically above and below the zero boundary.
Understanding how these individual components interact allows you to decode the core physical behavior of the indicator: convergence and divergence.
Convergence and divergence in MACD explained
Convergence occurs when the MACD lines and price action move in the same direction to confirm trend strength, while divergence happens when price and the indicator move in opposite directions, signaling an imminent trend reversal.
Convergence proves that the underlying trend is accelerating with genuine market volume, while divergence signals that price is making an unbacked move that has an exceptionally high probability of failing. Correctly tracking these shifting visual phases allows professional fund managers to anticipate massive capital reallocations before they become apparent to the broader retail market.
What does convergence mean in MACD?
Convergence occurs when the MACD lines and the underlying asset price candles move simultaneously in the exact same directional path. For example, if a currency pair climbs higher while the indicator line moves aggressively upward above the zero line, the technical system confirms that the bullish trend is driven by genuine, high-volume institutional buying pressure. This structural validation tells day traders that the current directional momentum is entirely stable and safe to join using standard trend-continuation techniques.
However, when this harmonious relationship breaks down, the indicator shifts into a far more significant phase.
What is divergence and why is it important?
Divergence occurs when the physical asset price and the momentum lines move in completely opposite directions, signaling severe hidden exhaustion in market volume. It is highly important because it serves as an early-warning radar for imminent trend collapses and massive market reversals:
- Regular Bullish Divergence: Price prints a lower swing low, but the indicator forms a higher swing low, proving that selling pressure is completely exhausted despite the lower nominal price.
- Regular Bearish Divergence: Price prints a higher swing high, but the indicator forms a lower swing high, revealing that institutional buying volume has evaporated and a market crash is likely.
Recognizing these structural discrepancies allows you to safely transition from abstract chart reading to executing highly accurate, actionable trading signals.
MACD signals and how to read them?
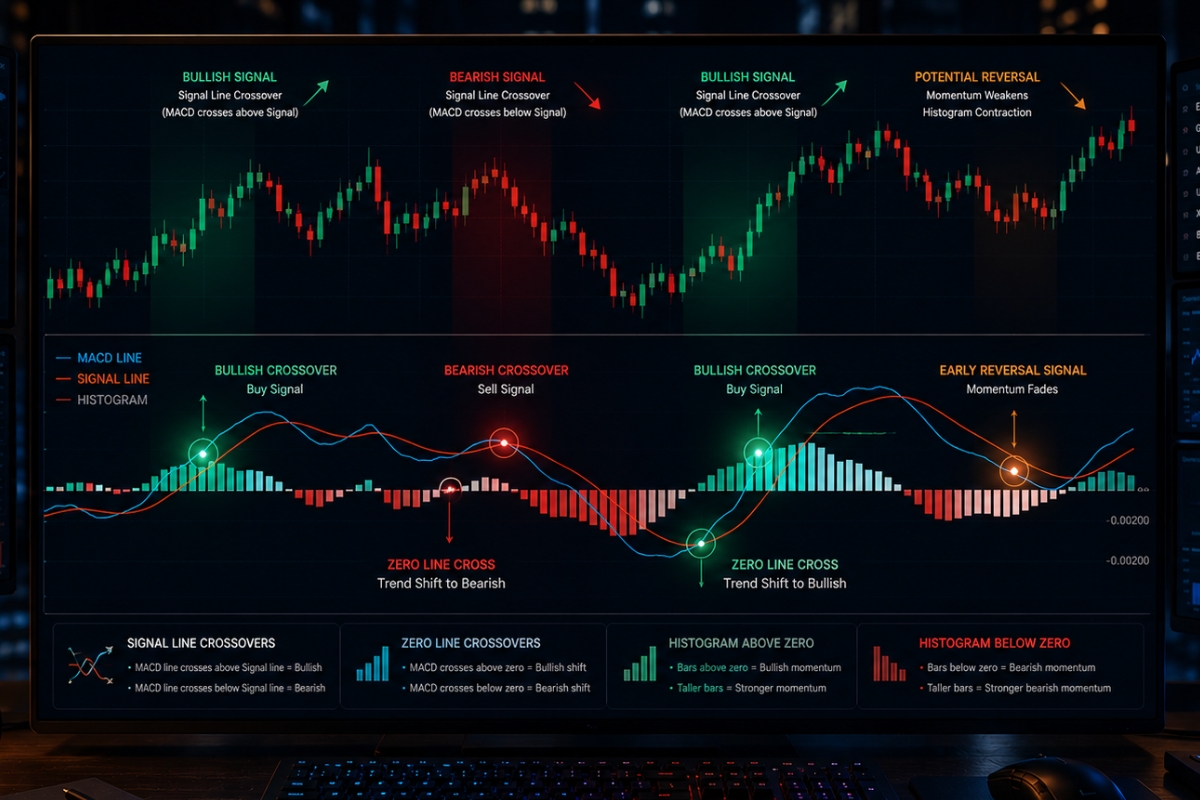
The primary MACD trading signals are triggered through two core mechanical events: the Signal Line Crossover and the Zero Line Crossover, both of which indicate an immediate shift in market control.
A crossover that occurs far away from the central zero line carries an 80% higher probability of follow-through than a crossover that manifests in a flat, range-bound market environment. By converting these visual line crossings into strict execution rules, an investor removes all emotional bias from their entry criteria, ensuring every position is backed by raw quantitative data.
What are the main MACD trading signals?
The technical layout provides three primary non-negotiable execution triggers:
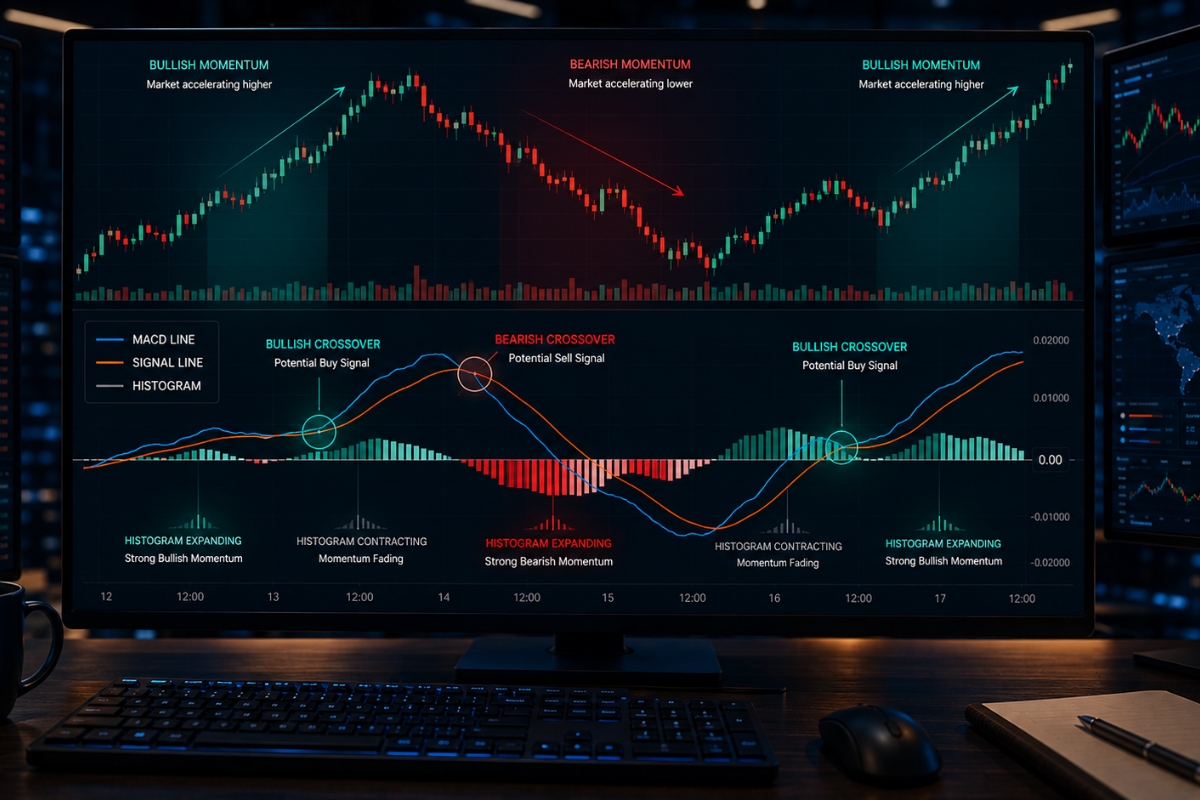
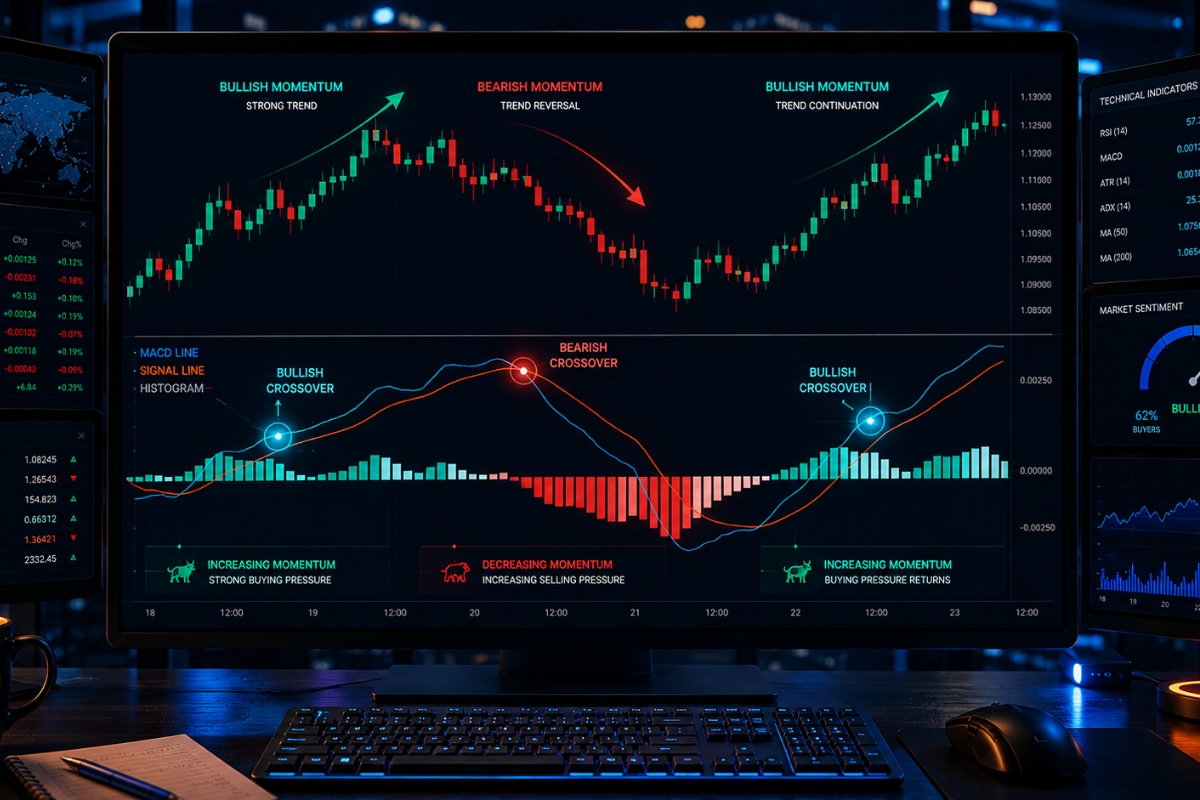
- Bullish Signal Line Crossover: Occurs when the faster MACD line crosses cleanly above the slower Signal line, indicating an immediate long entry opportunity.
- Bearish Signal Line Crossover: Manifests when the MACD line crosses below the Signal line, triggering an immediate short execution signal.
- Zero Line Crossover: When the lines cross above zero, it confirms a long-term bullish structural shift; crossing below zero validates a macro bearish environment.
To fine-tune these basic line signals, professionals cross-reference the data with the expansion and contraction of the vertical histogram bars.
How to read MACD histogram effectively?
Reading the histogram effectively requires tracking the rate of change in bar height relative to the central zero line. When the bars are expanding in height above zero, it indicates that the bullish trend is accelerating, making it highly profitable to hold open long positions. Conversely, when the histogram bars begin shrinking back toward the zero line, it signals an immediate momentum deceleration, providing an early warning to tighten stop-losses or lock in profits before a line crossover physically materializes on your charting window.
Once you have mastered these reading techniques, you can integrate them into complete, rule-based investment strategies tailored for various market environments.
MACD trading strategy for different market conditions
A professional MACD trading strategy adapts dynamically to changing market cycles by shifting between trend-following protocols and counter-trend reversal models depending on structural volatility.
Because no single technical setup works across all market cycles, top-tier fund operators isolate the current macro environment before deploying their portfolio capital. When these structured strategies are executed within optimal routing environments like the one featured on the MBroker, traders maximize their win-rates while minimizing execution slippage.
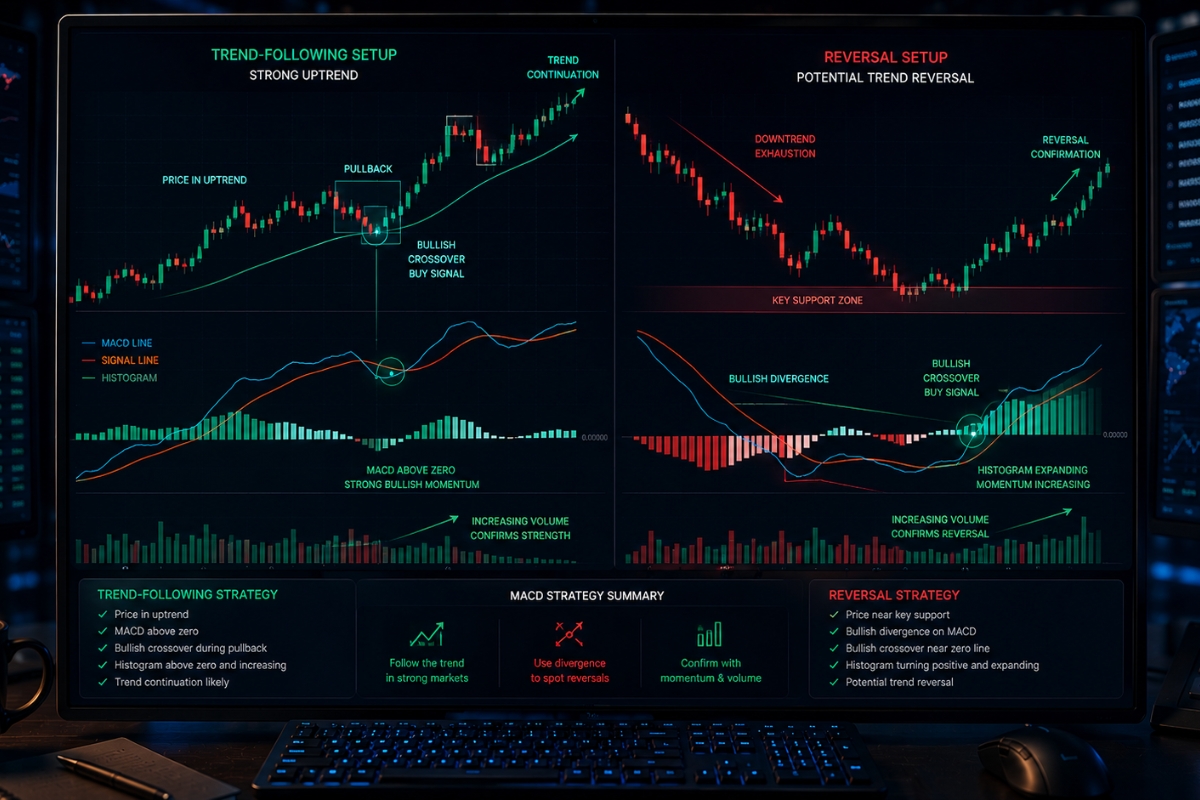
How to use MACD in trend-following strategy?
In a trend-following framework, the indicator is used exclusively to buy temporary pullbacks in the direction of the dominant macro trend.
To execute this, a trader first identifies a strong uptrend by ensuring both lines are trading completely above the zero level on a higher time frame.
When a minor downward corrective pullback occurs, the trader waits for the lines to form a fresh bullish crossover above the zero line, providing a high-probability entry point that aligns perfectly with the resumption of the broader institutional trend.
For markets that have extended too far, the strategy shifts toward hunting for major structural exhaustions.
How to apply MACD in reversal trading strategy?
To apply the oscillator within a reversal trading strategy, you must combine regular divergence patterns with a confirmed structural break in price action. For a bullish reversal setup, the trader waits for the market to form a clear regular bullish divergence in a historical daily support zone. The actual trade is triggered only when the MACD line executes a bullish crossover accompanied by an expanding green histogram, allowing the trader to capture the absolute bottom of a new market cycle with a highly compressed, protective stop-loss structure.
While these strategies are incredibly powerful on their own, institutional-grade mastery requires combining this tool with complementary technical indicators.
How to apply MACD indicator in real trading?
Applying the MACD indicator in real trading requires establishing a strict multi-indicator filter and avoiding common psychological execution traps that lead to retail account drawdowns.
Professional market analysts never isolate a single technical tool; instead, they build a cohesive confirmation matrix that balances momentum data with structural volume and price level analysis. By executing this systematic checklist before every order placement, you ensure your capital is only deployed during peak mathematical probability windows.
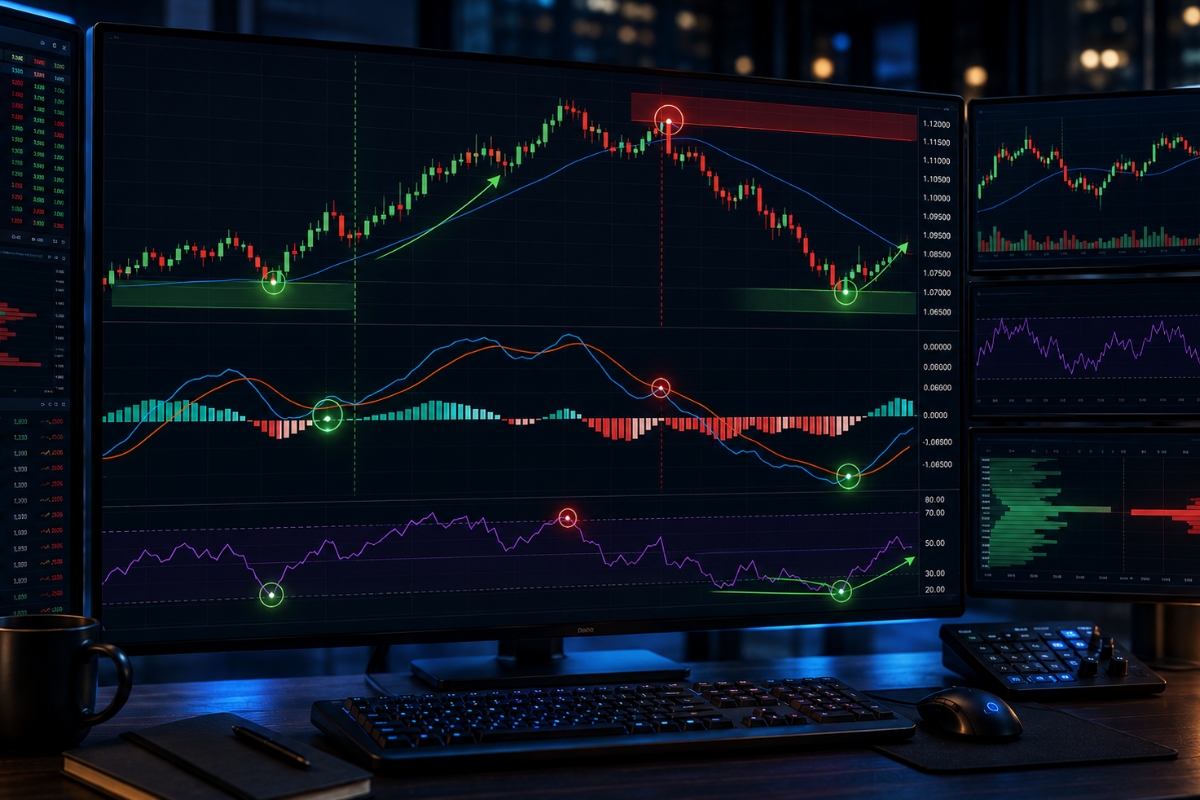
How to combine MACD with other indicators?
To eliminate false signals and maximize your strategy’s predictive accuracy, combine the indicator with these three complementary tools:
- The Relative Strength Index (RSI): Use the RSI to identify overbought ($$>7$$) or oversold ($$<3$$) boundaries, confirming the validity of your crossover signals.
- The 200-Period Simple Moving Average (SMA): Use the 200 SMA as a macro trend filter; only take bullish crossovers when price is above the 200 SMA, and only take bearish crossovers when price resides below it.
- Support and Resistance Levels: Only execute divergence signals that manifest directly at major daily or weekly horizontal structure zones to ensure high institutional order interest.
By cementing these strict filtering combinations into your daily routine, you can easily protect your portfolio from the most common retail execution blunders.
What are common mistakes when using MACD?
The most destructive mistake a trader can make is using the indicator blindly during a flat, sideways consolidating market. Because moving averages are inherently lagging indicators, a choppy market causes the lines to cross back and forth repeatedly, generating a sequence of false signals that can quickly deplete an account balance through overtrading.
In short, the MACD indicator is an invaluable tool for identifying momentum shifts, trend continuations, and high-probability market reversals. By combining its core lines with the RSI, filtering signals through the 200 SMA, and strictly avoiding choppy, range-bound markets, you can eliminate execution guesswork.

Thoren Vextal is a specialist in XM trading guides, offering practical insights and real-market experience to help traders improve their strategies and trading performance. Email: [email protected]