
 Tiếng Việt
Forex charts are visual tools that display price movements over time and help traders read market trends accurately, allowing beginners to understand how prices behave and identify trading opportunities.
However, forex chart patterns reveal repeating market behaviors that signal potential reversals or continuations, helping traders anticipate price direction based on formations like Head & Shoulders or Double Top.
Additionally, gold analysis using forex charts focuses on volatility and USD correlation, as XAU/USD tends to react strongly to economic news and interest rate changes.
Therefore, forex charts are essential for executing trading strategies, from identifying entry and exit points to managing risk effectively, making them a core tool for every trader.
In practice, combining chart reading, patterns, and market analysis improves trading accuracy and consistency, especially when applied within a structured trading plan.
In Forex, forex charts are the core tool for analysis and trading decisions. To gain deeper insights, you can explore Forex Technical Analysis to master knowledge and apply it effectively.
Forex charts and their role in trading analysis
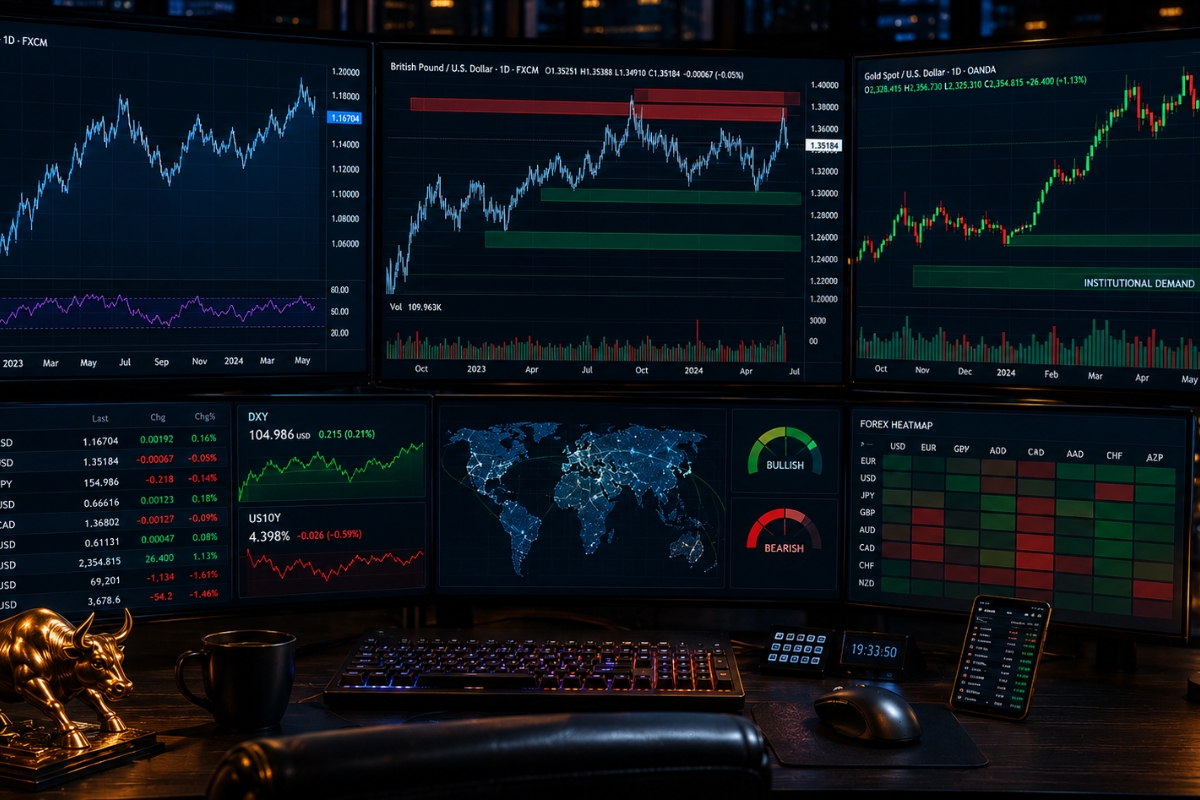
Forex charts are visual, graphical representations of historical price movements between currency pairs over specific time horizons, serving as the core foundation of technical analysis.

Statistically, over 80% of professional day traders rely heavily on these real-time data feeds because they aggregate billions of dollars in transaction volume into clear, scannable structural lines. By monitoring these price charts, market participants can instantly spot structural imbalances, identify systemic trend directions, and locate precise areas of institutional demand.
What are forex charts and why are they important?
A forex chart functions as a continuous, two-dimensional map where the vertical axis (Y-axis) measures price and the horizontal axis (X-axis) measures time. These charts are vital because they eliminate emotional market noise, providing an objective mathematical record of exactly where buyers and sellers agreed on value over any given minute, hour, or day. Without these visual records, navigating the decentralized interbank network would be mathematically impossible, making the chart your primary instrument for risk evaluation.
While the underlying price data remains constant, the visual manner in which this data is displayed completely alters your technical insights.
What types of forex charts are commonly used?
Technical analysts primarily utilize three distinct graphical variations to track global currency trends:
- Line Charts: A simplistic model that connects consecutive closing prices with a continuous line, ideal for filtering out intraday noise to see the macro trend.
- Bar Charts (OHLC): A more detailed structure showing the Open, High, Low, and Close for each specific period, illustrating the complete trading range.
- Candlestick Charts: The industry standard that utilizes colored bodies and wicks to provide an immediate visual summary of bullish or bearish momentum.
Once you select your preferred chart configuration, the next operational step is learning to read the internal anatomy of price delivery.
How to read forex charts for beginners?
Reading forex charts for beginners requires a systematic understanding of price quotes and the mechanical relationship between base and quote currencies across changing timeframes.
When looking at a currency pair like EUR/USD, the chart illustrates exactly how much of the quote currency (USD) is required to purchase one single unit of the base currency (EUR). For instance, if the chart reflects a value of 1.0850, it means 1 Euro is currently worth exactly 1.0850 US Dollars, and an upward curve reveals that the base asset is actively strengthening.
How to read price movement on forex charts?
Price movement on a technical chart is read from left to right, tracking the sequence of structural “swing highs” (peaks) and “swing lows” (troughs). A market moving in a series of consecutive higher highs and higher lows is officially classified as an uptrend, signaling that aggressive buying pressure is dominating the order book. Conversely, a steady progression of lower highs and lower lows confirms a clear downtrend, alerting you that institutional sellers are heavily liquidating their inventory.
To navigate these shifting trends without experiencing heavy capital drawdowns, a beginner must learn to prioritize specific data metrics.
What are key elements beginners should focus on?
When interacting with a live terminal, a novice market participant should restrict their focus to four foundational variables:
- The Timeframe Matrix: Selecting the correct chart interval (e.g., Daily for macro trends, 15-Minute for precise execution entries).
- Support and Resistance Floors: Locating historical price zones where the market repeatedly reverses, mapping out supply and demand nodes.
- The Current Spread: Monitoring the micro-gap between the Bid and Ask prices to evaluate localized transaction costs.
- Platform Optimization: Utilizing the clean data feeds and analytical guidelines featured on the MBroker to ensure your charting parameters align with professional institutional standards.
By mastering these basic components, you can comfortably transition from reading simple raw lines to identifying advanced geometric trend formations.
Forex chart patterns and how they signal market behavior?
Forex chart patterns are distinct, recurring geometric shapes formed by price action that signal predictable shifts in institutional supply and demand.
In live financial markets, these structures display an exceptionally high historical probability of success because they represent the collective psychological reactions of traders to fear, greed, and structural uncertainty. By identifying these shapes early, you can systematically anticipate whether the prevailing market trend is preparing for an explosive directional continuation or a complete structural reversal.
What are the most common forex chart patterns?
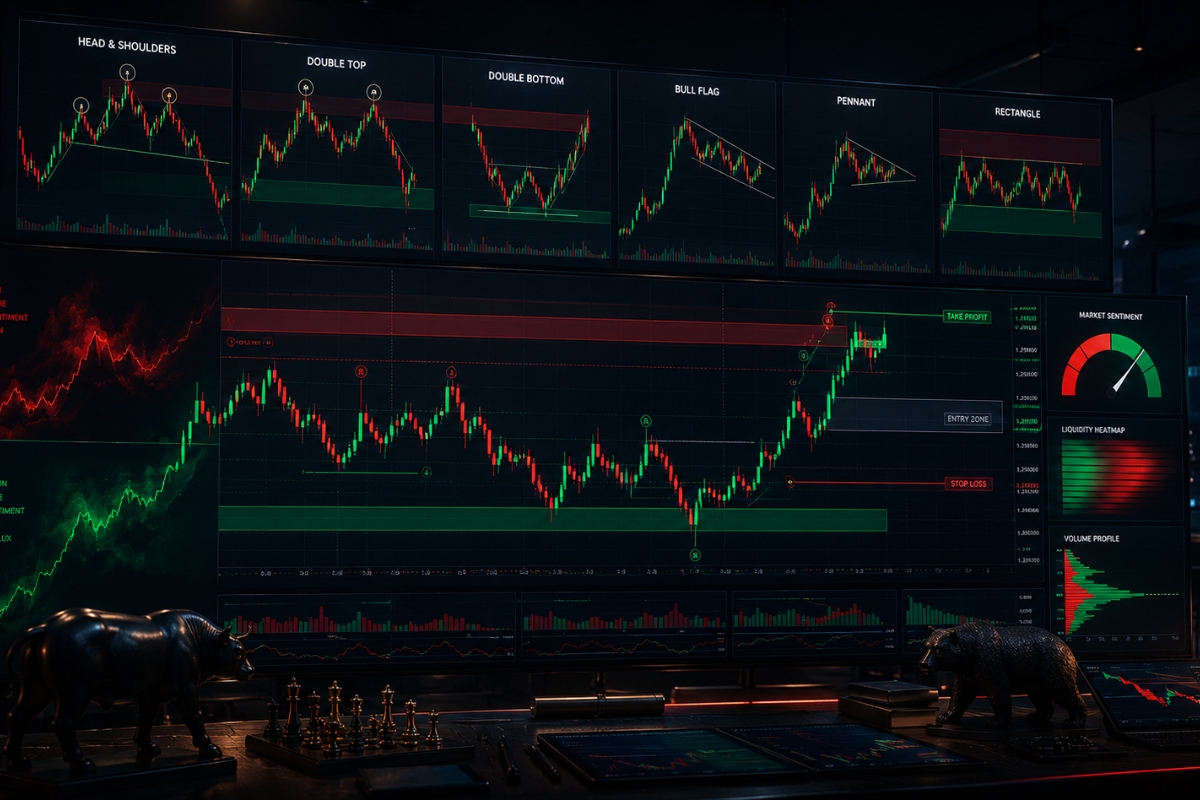
Professional analysts split classical geometric shapes into two primary operational categories:
- Reversal Patterns: Structures like the Head and Should Bars, Double Tops and Double Bottoms, which signal that the current trend has completely exhausted its momentum and is reversing.
- Continuation Patterns: Formations such as Bull Flags, Pennants, and Rectangles, which indicate that the market is briefly resting before resuming its primary directional drive.
Recognizing these geometric outlines on your screen is the first step toward building a data-driven trading edge.
How do chart patterns improve trading decisions?
Chart patterns dramatically enhance your strategic accuracy by providing precise, rule-based parameters for every market entry and exit. Instead of executing trades based on raw emotional guesswork, a verified chart structure tells you exactly where to place your protective stop-loss (just outside the pattern boundaries) and how to calculate your take-profit target (based on the pattern’s vertical height). This systematic consistency eliminates human error, allowing you to maintain a highly favorable risk-to-reward ratio over a large sample of executions.
While these standard patterns apply seamlessly to traditional currencies, applying them to agricultural or commodity assets requires specialized macro adjustments.
Gold analysis using forex charts
Gold analysis using forex charts requires tracking the structural price behavior of XAU/USD, which pairs the world’s premier safe-haven commodity against the global reserve currency.

Statistically, gold charts display a highly aggressive volatility profile, often experiencing intraday price swings exceeding 1.5% to 2% during periods of intense geopolitical tension or unexpected inflationary adjustments. Because gold behaves simultaneously as a physical commodity and a monetary hedge, analyzing its chart provides massive insights into global macroeconomic risk distribution.
How to analyze gold trends using forex charts?
Analyzing a gold chart successfully requires combining classical support and resistance levels with macro-driven technical indicators. Because gold is highly sensitive to real interest rates and dollar strength, an analyst should look for structural breakouts on higher timeframes (such as the 4-Hour or Daily chart) to isolate institutional trend direction. Additionally, pairing your chart analysis with momentum tools like the Relative Strength Index (RSI) helps you spot when an aggressive gold rally is becoming technically overextended and ripe for a sharp correction.
To trade this asset safely, you must respect the unique behavioral quirks that separate metals from standard fiat assets.
What makes gold charts different from forex pairs?
Gold charts exhibit several distinct operational characteristics that differentiate them from standard currency pairs:
- Extreme Liquidity Spikes: Gold attracts massive institutional block orders, leading to swift, large-scale price expansions that can easily blast through minor retail support levels.
- Geopolitical Sensitivity: During global banking panics or international conflicts, gold charts will often break historical technical resistance levels, completely ignoring traditional bearish indicators.
- Macro-Correlation: XAU/USD moves in a strong inverse relationship with US Treasury yields, meaning a drop in bond yields almost always triggers an immediate bullish expansion on the gold chart.
With your technical analysis adjusted for both currencies and commodities, the final phase involves integrating these concepts into a practical strategy.
Applying forex charts in real trading strategies
Applying forex charts in real trading strategies requires converting raw geometric data into an immutable, rule-based execution workflow that removes emotion from the trading terminal.
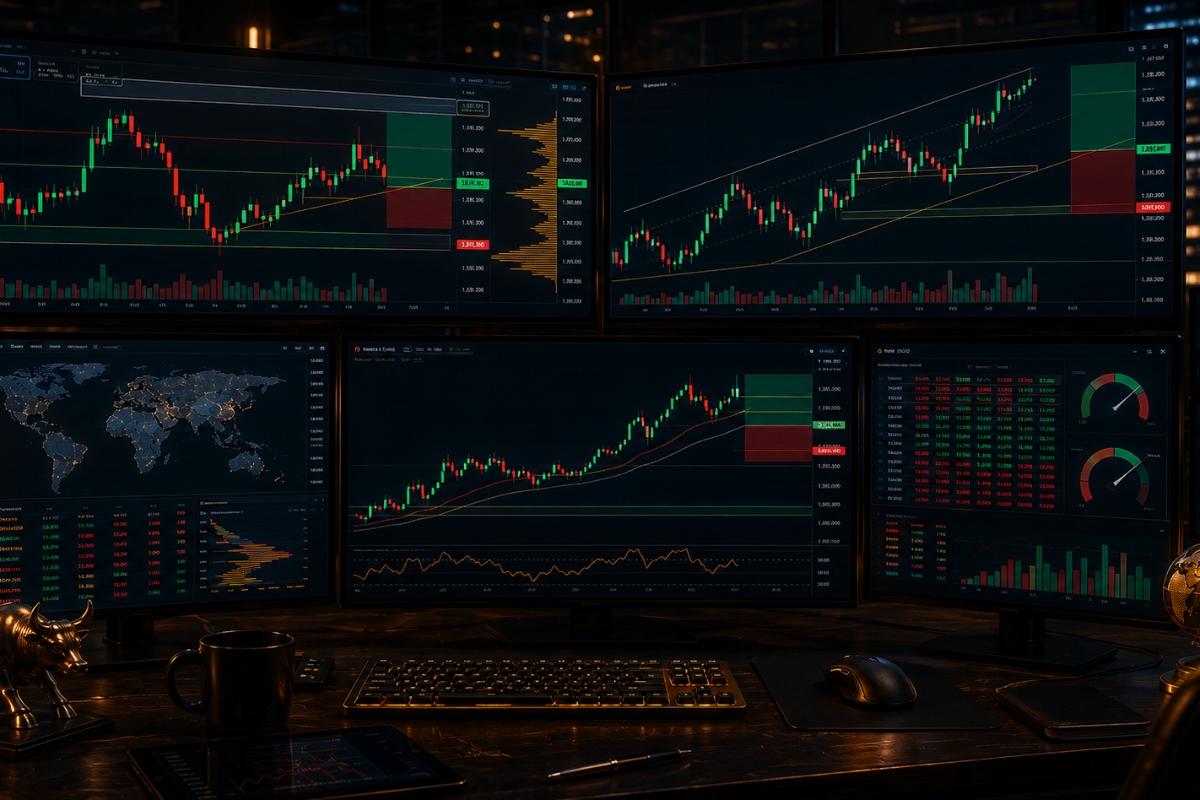
Even the most beautiful chart pattern is completely useless unless it is tied to a strict risk management framework and a verified entry trigger. By treating your technical layout as a structured business model, you can systematically exploit price inefficiencies across various global asset classes while strictly protecting your underlying capital.
How to use forex charts for trading entries and exits?
Using price charts for execution requires waiting for absolute structural confirmation before committing any financial capital. For a high-probability entry, a trader must wait for a candlestick body to close completely outside a defined support, resistance, or pattern boundary line on a high timeframe. Once this breakout is achieved, the exit parameters are automatically defined: the stop-loss is positioned safely behind the breakout candle’s wick, and the take-profit target is projected outward to a major historical supply zone.
To execute this mechanical sequence consistently, you must formalize your rules into a comprehensive, repeatable system.
How to build a trading strategy based on charts?
Building an institutional-grade chart strategy relies on a strict 5-step operational protocol:
- Define Your Universe: Select a core group of high-liquidity assets (e.g., Major currency pairs and Gold) to track daily.
- Establish the Macro Bias: Scan the Daily chart to determine whether the broader market is trending upward, downward, or consolidating horizontally.
- Locate Execution Nodes: Draw your key horizontal support and resistance lines to identify the exact areas where you want to interact with the market.
- Wait for the Signal: Execute your trade only when a verified chart pattern or candlestick breakout occurs at your pre-drawn level.
- Optimize via Premium Networks: Executing your calculated strategy through the institutional infrastructure, raw spreads, and educational toolkits found on the MBroker ensures maximum execution speed and zero emotional friction.
In conclusion, mastering Forex Charts is an essential requirement for minimizing capital exposure and optimizing trade precision. By focusing your strategy on high-probability geometric structures, adapting your parameters for volatile gold analysis, and adhering to strict rule-based execution filters, you can confidently turn market volatility into a sustainable commercial edge.

Thoren Vextal is a specialist in XM trading guides, offering practical insights and real-market experience to help traders improve their strategies and trading performance. Email: [email protected]