
 Tiếng Việt
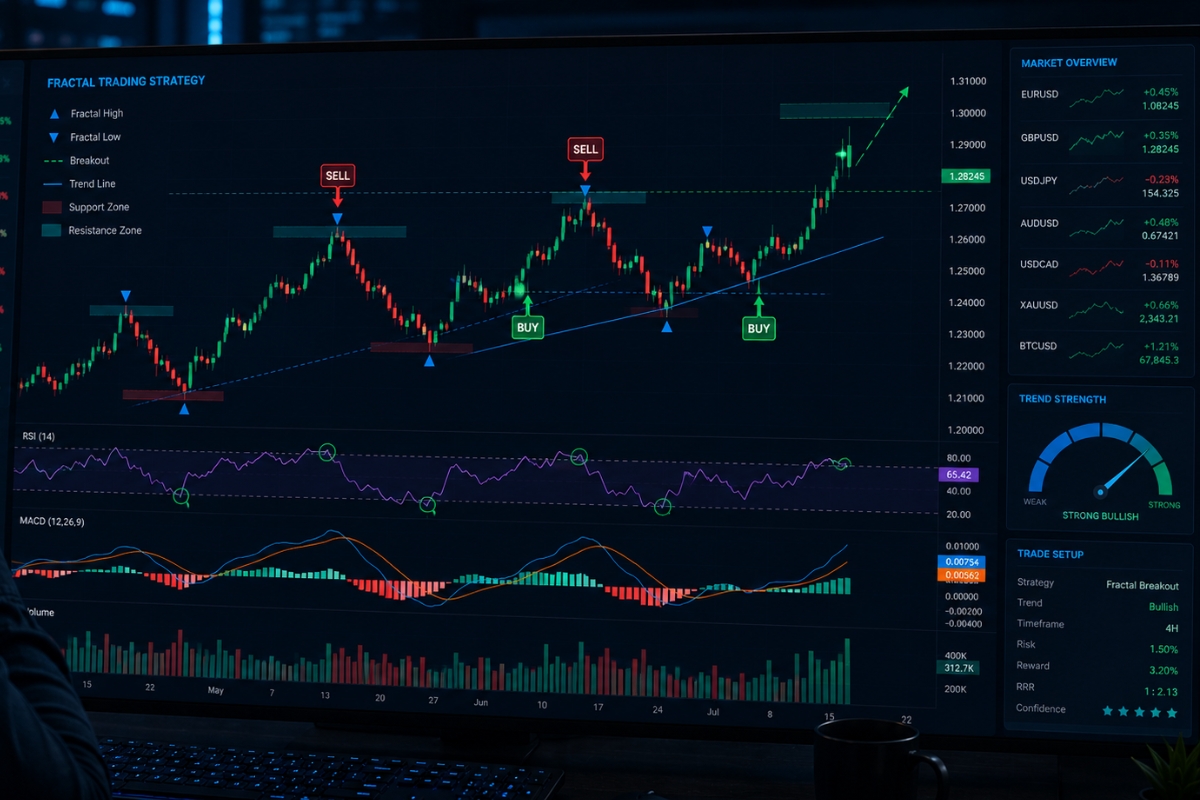
Fractal trading strategy is a method that uses repeating price patterns to identify market turning points, detect highs and lows based on recurring structures in financial markets.
Next, Fractal indicators identify local highs and lows through a 5-candle pattern structure, allowing traders to visualize potential reversal zones and key support/resistance levels.
Then fractal trading signals are generated when price forms confirmed fractal highs or lows, often used to trigger Buy/Sell entries when combined with trend confirmation tools.
Additionally, fractal trading strategy works best when combined with trend indicators to filter false signals, improving accuracy and helping traders avoid noise in volatile markets.
In Forex, Fractal Trading Strategy helps identify reversal points based on repeating price patterns. To use it effectively, you need to understand how fractals work and how to read their signals. This article will guide you step by step, and you can also explore more in the Forex Trading Strategy category to improve your trading skills.
What is fractal trading strategy and how it works?
A fractal trading strategy is a rule-based technical framework that identifies recurring, self-similar price patterns that repeat across all measurable timeframes, from 1-minute scalping charts to monthly macro horizons.
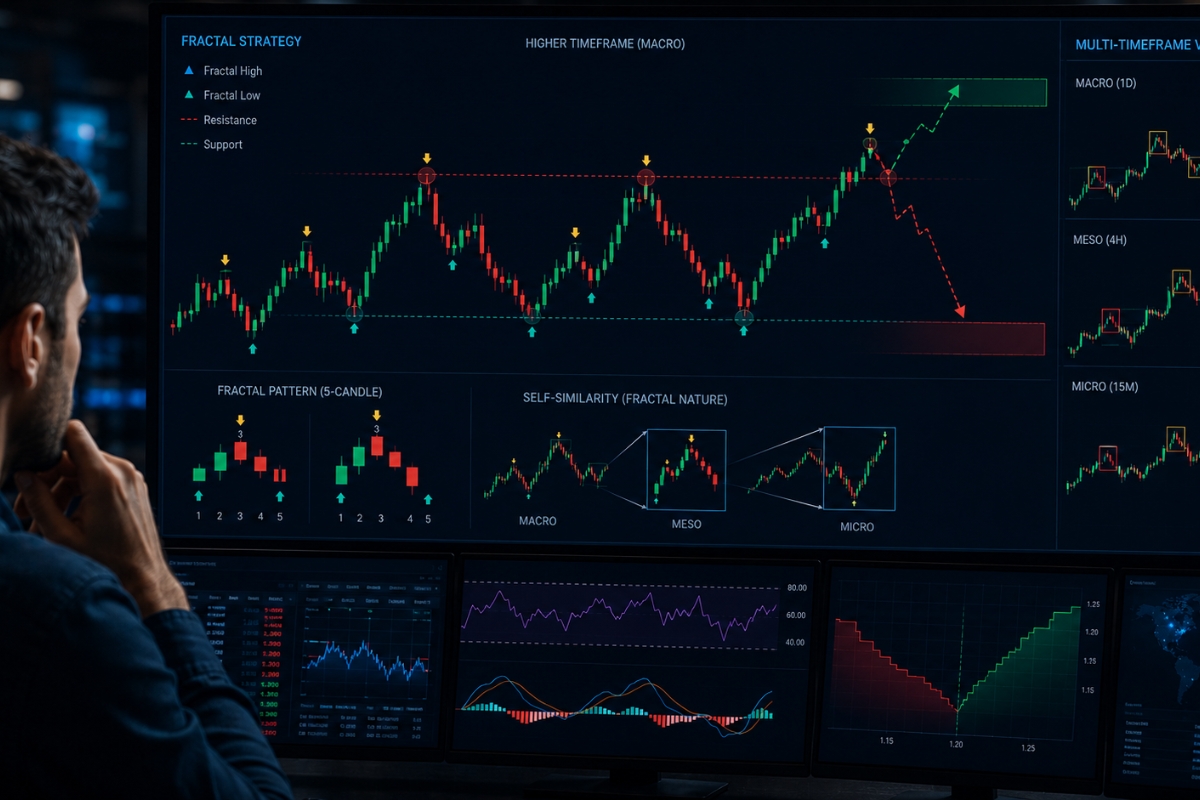
Statistically, this strategy relies on the mathematical principle that market structures are non-linear and fractional, meaning a micro-pattern visible on a 5-minute chart mirrors the exact behavioral architecture of a macro-pattern on a weekly chart. By isolating these key structural pivot points, traders can pinpoint precise market reversals and continuation zones with high mathematical accuracy.
What is fractal trading in financial markets?
In financial markets, fractal trading refers to the identification of specific five-candle geometric configurations that signal a local swing high or swing low. Originally introduced to the trading community by legendary analyst Bill Williams, a trading fractal acts as a structural milestone that marks a temporary exhaustion of buying or selling momentum. These formations are not random anomalies; they represent the precise points where the market rebalances its order book, transferring directional control from aggressive buyers to passive sellers, or vice versa.
While the definition establishes the core concept, observing how this geometry functions in a live environment clarifies its operational value.
How does fractal trading strategy work in practice?
In live market practice, a fractal trading strategy functions as an objective filtering mechanism to identify support, resistance, and breakout triggers. The strategy operates through a systematic, multi-layered sequence:
- Structural Filtering: The strategy scans the chart for a completed five-candle setup where the middle candle possesses the highest high or the lowest low of the entire group.
- Support and Resistance Mapping: Once a fractal is printed, its extreme tip is projected forward as a horizontal line, establishing a key psychological barrier.
- Breakout Execution: When the live price moves past a previous upward fractal tip, a long trade is triggered; conversely, breaking below a downward fractal tip triggers a short position.
Connecting these practical actions back to macroeconomic chart theory helps explain why these geometric patterns constantly repeat over time.
Fractal trading meaning in technical analysis
The underlying meaning of a fractal trading strategy in technical analysis is rooted in the study of behavioral economics and chaos theory, which states that human trading psychology remains constant regardless of the timeframe being analyzed.

In classical chart theory, fractals prove that financial markets possess a “memory,” where collective fear and greed manifest as identical geometric shapes over and over again. Instead of treating price action as a series of disconnected events, fractal meaning provides a holistic view of the market as a single, interconnected, self-repeating system.
Why do fractals repeat in financial markets?
Fractals repeat in financial markets because the fundamental drivers of price action—namely institutional order execution, retail FOMO (Fear Of Missing Out), and programmatic algorithmic trading—operate identically across all market cycles. Whether an automated algorithm is clearing inventory on a 1-hour chart or a major sovereign fund is accumulating an equity position over a fiscal quarter, the resulting footprint on the tape creates the same expanding and contracting waves. Because human and algorithmic reactions to support and resistance thresholds are hardwired, the exact same geometric signatures reappear indefinitely.
Understanding the psychological cause of these shapes allows professionals to apply fractal theory directly to active portfolio management.
How does fractal theory apply to trading decisions?
Fractal theory applies to active trading decisions by providing a clear framework to identify trend direction and filter out market noise. Specifically, when a market is in a powerful uptrend, it will continuously break and close above preceding upward fractals while leaving downward fractals untouched. Traders use this structural layout to align their positions with the dominant institutional trend, manage trailing stop losses, and scale into winning positions. For operators executing these multi-timeframe strategies, aligning your entries with the educational resources and premium feeds found on the MBroker ensures your technical application remains mathematically sound.
Once the theoretical meaning is mastered, the next operational milestone is learning how to plot these shapes automatically using specialized technical tools.
Fractal indicators and how to use them?
Fractal indicators are automated software tools that scan price charts in real-time to highlight valid five-candle reversal structures, removing subjectivity and human error from geometric chart analysis.
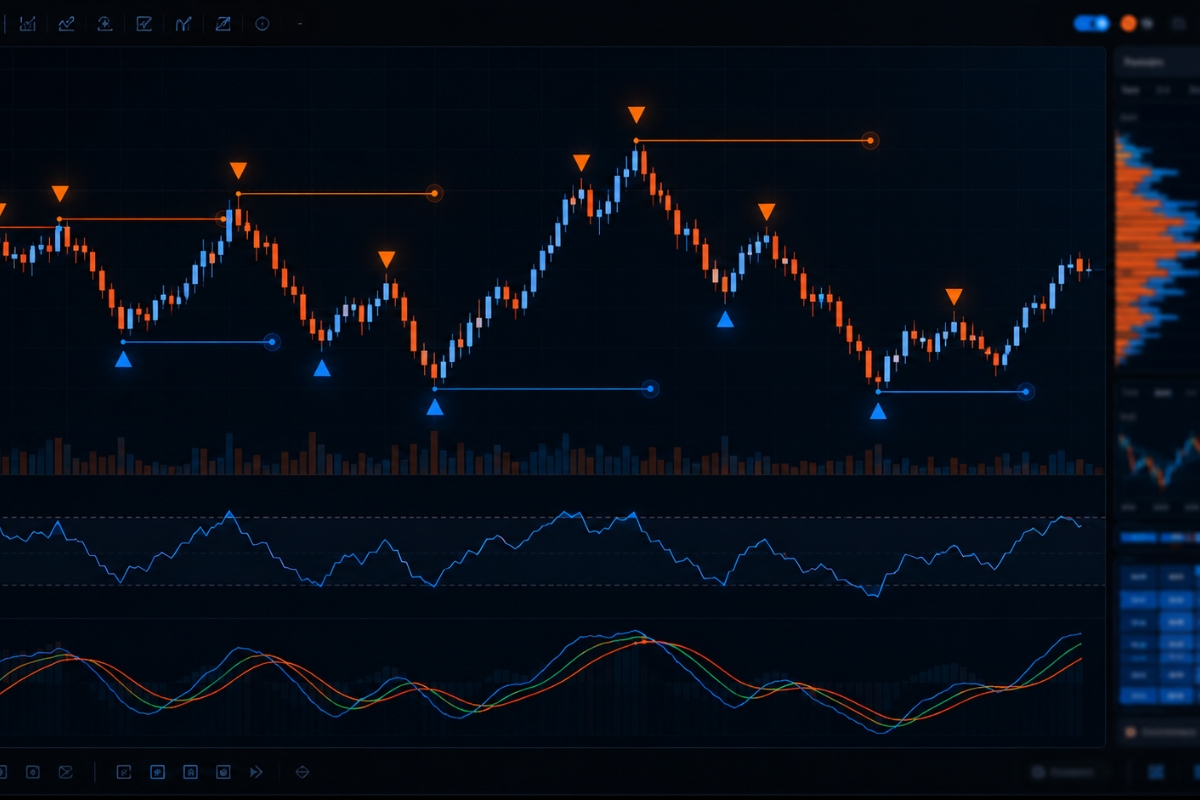
Most modern trading terminals include a native Bill Williams Fractal Indicator, which automatically places an upward arrow above local resistance peaks and a downward arrow below local support troughs. Utilizing these automated indicators allows a market technician to quickly analyze multiple currency pairs or corporate stocks simultaneously, drastically increasing structural sorting efficiency.
How does the fractal indicator identify highs and lows?
The fractal indicator identifies structural highs and lows by executing a strict, symmetrical mathematical formula across a rolling sequence of five consecutive candles:
- Upward Fractal (Bearish Reversal): This signal is printed when the third candle’s height is strictly higher than the highs of both the two preceding candles (candles 1 and 2) and the two succeeding candles (candles 4 and 5).
- Downward Fractal (Bullish Reversal): This signal is printed when the third candle’s low is strictly lower than the lows of both the two preceding candles and the two succeeding candles.
High_3 > High_1, High_2, High_4, High_5
Low_3 < Low_1, Low_2, Low_4, Low_5
It is critical to note that, because the indicator requires two succeeding candles to close before it can validate the middle peak, a true fractal arrow always prints with a two-candle delay.
Recognizing this native calculation delay is essential for developing an efficient, professional application strategy.
What is the best way to use fractal indicators in trading?
The most effective way to use fractal indicators in a professional trading business is to treat them as liquidity milestones rather than standalone buy or sell signals. Because of the inherent two-candle calculation lag, entering a trade the exact moment an arrow appears often results in entering late. Instead, the best practice is to use fractal tips to draw clean, horizontal support and resistance rays, and then combine these levels with momentum tools like the RSI or the Alligator Indicator to enter into a high-volume breakout or a verified structural rejection.
Once you can smoothly navigate the indicator’s settings, you are ready to isolate the explicit trading signals generated by this strategy.
Trading signals from fractal trading strategy
Trading signals derived from a comprehensive fractal trading strategy provide binary, rule-based entry and exit triggers that eliminate emotional guesswork from the execution phase.
The primary signals focus on breakout sequences, where price successfully breaches a historical fractal line, and reversal sequences, where price rejects a fractal level while displaying a clear momentum divergence. By pairing these structural price boundaries with disciplined risk protocols, a trader can systematically exploit market imbalances with an institutional edge.
What are the main fractal trading signals?
The two primary execution signals generated by a professional fractal framework follow strict behavioral rules:
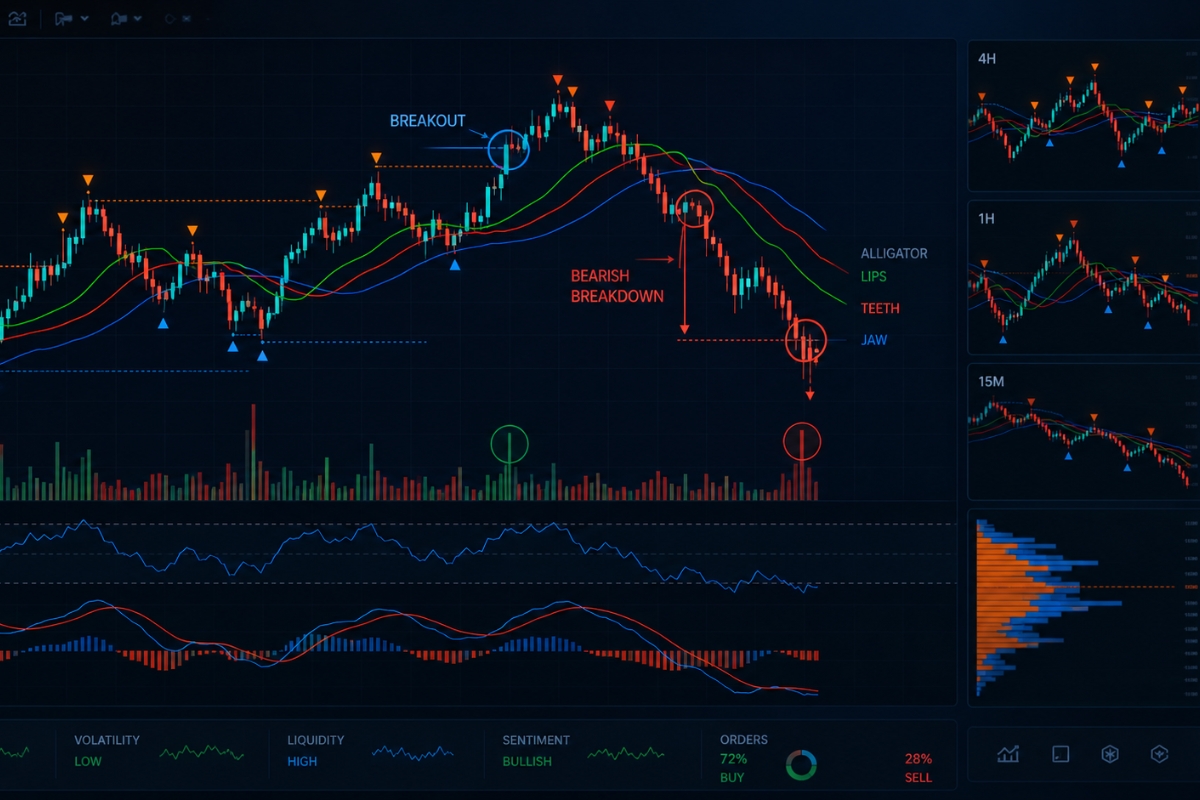
- The Fractal Breakout Signal: A long signal occurs when the market closes completely above the most recent upward fractal arrow, confirming an expansion of bullish demand. A short signal is triggered when price closes below the lowest point of a downward fractal arrow.
- The Bill Williams Alligator Confluence: To ensure trend alignment, traders only take long breakout signals if the price is trading completely above the Alligator’s Teeth (red line) and Jaws (blue line). For short positions, the breakout must occur strictly below the Alligator structure.
While these primary signals are highly effective, trading them blindly during low-liquidity sessions can expose an account to severe false breaks.
How to avoid false signals in fractal trading?
To successfully filter out false signals and avoid getting trapped in “whipsaw” consolidations, enforce three strict operational parameters:
- Timeframe Filtering: Prioritize fractal signals that develop on the 4-Hour, Daily, or Weekly charts, as higher timeframes carry significantly more institutional order volume and suffer from far less random market noise than lower-tier 5-minute segments.
- Volume Verification: Ensure the breakout candle closing past the fractal tip coincides with a noticeable volume expansion, proving that major financial funds are actively backing the move.
- Utilize Premium Platforms: Reviewing your technical setups alongside the institutional analysis and professional market commentary provided on the MBroker allows you to verify that your technical signals align with broader macroeconomic liquidity flows, keeping you on the right side of the market.
In summary, a Fractal Trading Strategy provides technical analysts with an exceptionally robust, geometric map to navigate the complex, non-linear reality of global financial markets. By understanding the psychological meaning behind repeating patterns, utilizing automated indicators correctly, and enforcing multi-timeframe trend filters, you can successfully turn market chaos into a scalable commercial edge. To continuously refine your execution precision and stay updated on institutional market conditions, ensure you keep the MBroker homepage as your core technical analysis resource.

Thoren Vextal is a specialist in XM trading guides, offering practical insights and real-market experience to help traders improve their strategies and trading performance. Email: [email protected]