
 Tiếng Việt
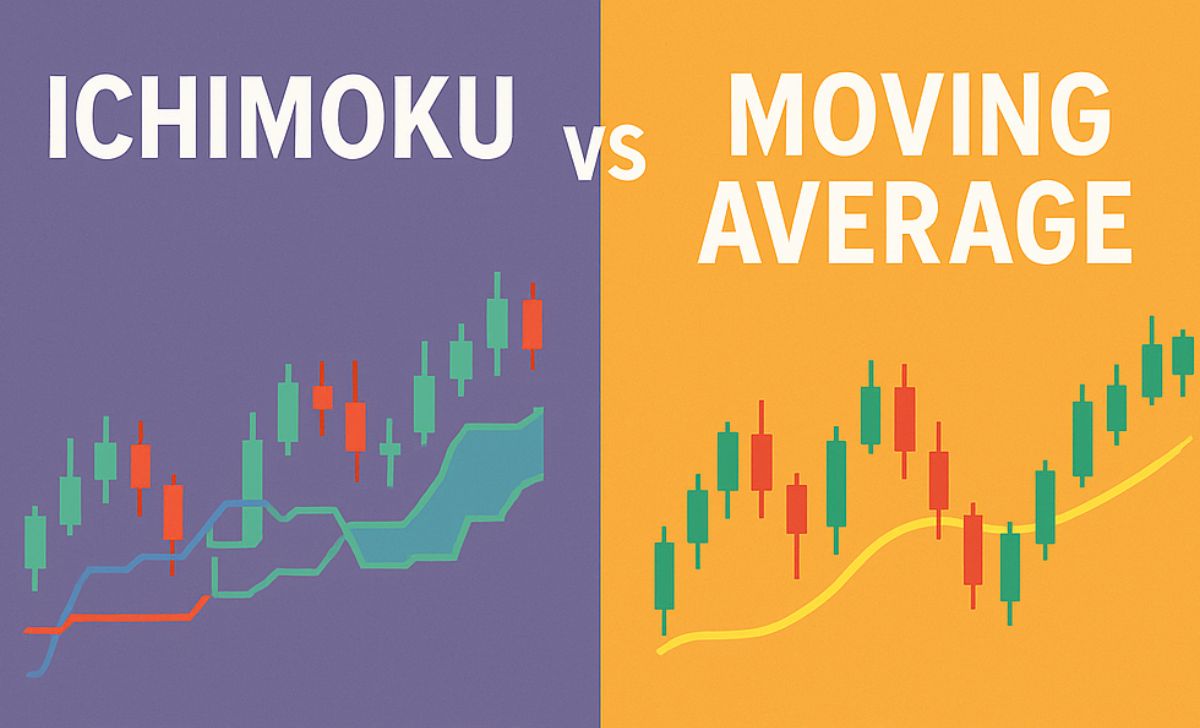
Both Ichimoku Kinko Hyo and Moving Averages are popular tools for identifying trends, support/resistance levels, and potential entry points. While Moving Averages offer simplicity and clarity, Ichimoku delivers a comprehensive, all in one view of the market.
Choosing between Ichimoku and Moving Averages depends on your trading style. Let’s break down how each works and which one gives you the edge in different market conditions. In this guide, we’ll compare these two indicators to help you decide which suits your trading strategy best especially when trading on XM platforms.
What Are Ichimoku and Moving Averages?
Ichimoku Kinko Hyo and Moving Averages are two of the most widely used tools in technical analysis, both designed to help traders understand trend direction, momentum, and potential entry/exit points. While they serve similar purposes, each offers a unique perspective on price behavior and market structure.
What Is Ichimoku Kinko Hyo and How Does It Work?
Ichimoku Kinko Hyo is a multi dimensional trading system that combines trend, momentum, and support/resistance into a single chart. Developed in Japan, it aims to identify the “equilibrium” point of price through visual layers. It consists of five main components:
-
Tenkan-sen (Conversion Line) – Short-term average (typically 9 periods)
-
Kijun-sen (Base Line) – Medium-term trend confirmation (typically 26 periods)
-
Senkou Span A & B – Projected into the future, these lines form the Kumo Cloud
-
Chikou Span (Lagging Line) – Plots current price against past values
The Kumo Cloud is central, showing zones of likely support and resistance. A wide cloud indicates strong trend potential; a flat cloud suggests consolidation. This approach reflects the philosophy of “momentary balance”, aligning market forces across timeframes.
What Is a Moving Average and What Are Its Types?
A Moving Average (MA) is a trend following indicator that smooths historical price data to help traders visualize direction and momentum over time. Common types include:
-
SMA (Simple Moving Average) – Straight average of past prices over a given period
-
EMA (Exponential Moving Average) – More responsive to recent price changes
-
WMA (Weighted Moving Average) – Custom weights applied to each value
Moving Averages are often used to detect crossovers (e.g., 50 EMA vs. 200 EMA), which may indicate trend shifts. They also act at dynamic support and resistance levels, especially in trending markets.
According to the London School of Economics, Financial Mathematics Division (2021), Moving Averages remain reliable in trend confirmation strategies, particularly when paired with volatility indicators like Bollinger Bands or ATR.
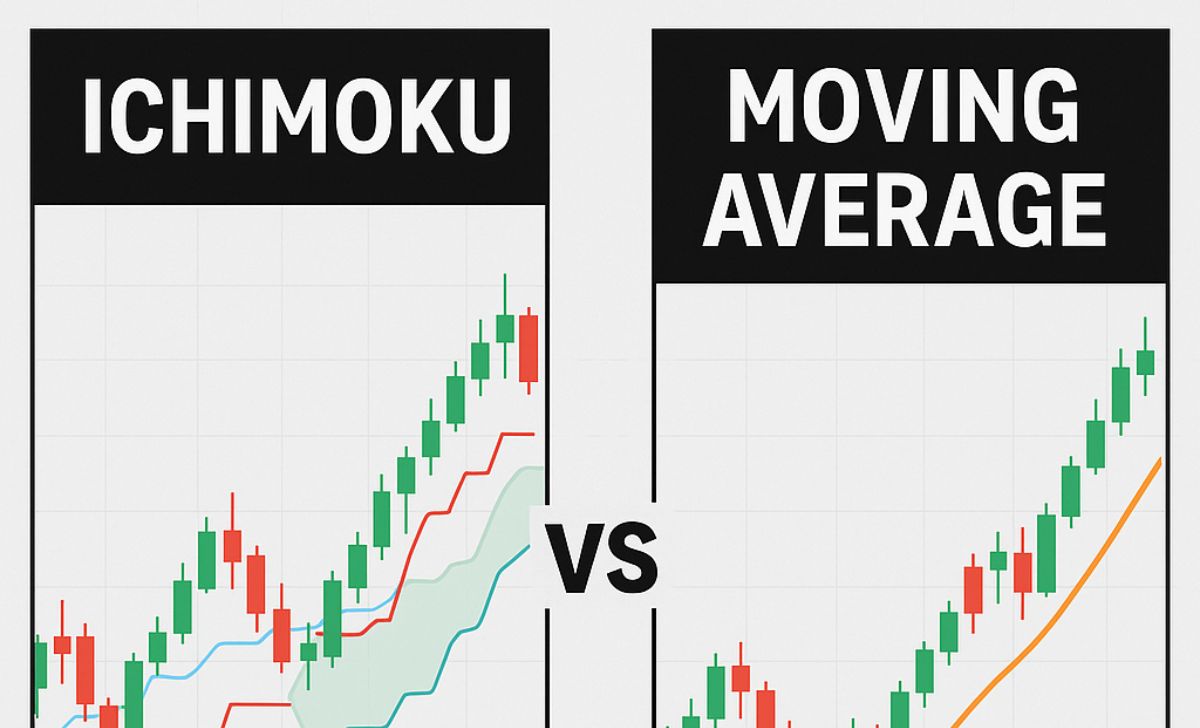
How Do These Two Tools Differ in Trend Identification?
Ichimoku Kinko Hyo and Moving Averages (MA) both serve to identify market trends, but they do so using fundamentally different logic. While Ichimoku emphasizes multi-dimensional equilibrium through cloud structure and line interaction, Moving Averages rely on smoothed historical prices to define momentum and direction. The key distinctions are explored below.
How Does Ichimoku Identify Trends Through the Kumo Cloud?
Ichimoku Kinko Hyo uses the Kumo (cloud) as a dynamic trend filter:
-
Color and Thickness of Kumo:
-
A green (bullish) cloud suggests upward momentum; a red (bearish) cloud indicates downward pressure.
-
Thicker clouds represent stronger support/resistance zones and more stable trends.
-
-
Price Position Relative to the Kumo:
-
Above the cloud = bullish trend
-
Below the cloud = bearish trend
-
Inside the cloud = consolidation or neutral zone
-
-
Tenkan-sen and Kijun-sen Crossovers:
-
A bullish crossover (Tenkan crossing above Kijun) supports trend confirmation if it occurs above the cloud
-
A bearish crossover is valid when it happens below the cloud
-
According to the Osaka Institute of Technology (2021), Ichimoku excels at identifying sustainable trends due to its forward-shifted cloud and the multi-line validation system.
How Do Moving Averages Define Trends Through MA Lines?
Moving Averages simplify trend recognition by calculating averages of historical prices over set periods. Key applications include:
-
Short-Term MA (e.g., MA 20): Reacts quickly to price changes, useful for entry/exit timing
-
Medium-Term MA (e.g., MA 50): Filters short-term noise
-
Long-Term MA (e.g., MA 200): Defines long-term trend direction
Key patterns:
-
Golden Cross: MA 50 crosses above MA 200 → Bullish signal
-
Death Cross: MA 50 crosses below MA 200 → Bearish signal
-
Support/Resistance Behavior:
-
In an uptrend, MAs often act as dynamic support
-
In a downtrend, they serve as resistance levels
-
The University of Toronto’s Department of Quantitative Finance (2020) found that MA crossover strategies, particularly on higher timeframes, deliver reliable directional signals when filtered by volume or momentum indicators.
Which Tool Gives Clearer Trend Signals in Sideways Markets?
Ichimoku is more cautious, while Moving Averages tend to give noisy signals.
-
Moving Averages: Highly susceptible to false signals in choppy or ranging conditions due to lagging nature. Crossovers may occur frequently without meaningful trend shifts.
-
Ichimoku: Offers better filtering by waiting for clear price displacement outside the Kumo Cloud, reducing premature entries.
A 2022 study by the Singapore Management University (SMU), School of Economics concluded that Ichimoku outperformed MA systems in sideways markets by reducing signal frequency by 35% while increasing trend accuracy. These findings underscore its value for those who aim to learn trading with a focus on reliability and noise reduction.
What Are the Strengths and Weaknesses of Ichimoku and Moving Averages?

Ichimoku Kinko Hyo and Moving Averages are widely used for trend analysis, but each offers distinct advantages and limitations. Understanding their strengths and drawbacks helps traders select the tool that fits their strategy, skill level, and market environment.
What Are the Key Strengths of Ichimoku?
Ichimoku offers a multi dimensional approach to technical analysis by consolidating various elements into a single visual system. Its key advantages include:
-
Comprehensive Chart View: Displays trend direction, momentum, support and resistance, and volatility zones all at once, reducing the need for multiple indicators.
-
Simultaneous Analysis of Past, Present, and Future: The forward-shifted Kumo cloud and lagging Chikou Span allow traders to assess price dynamics across timeframes.
-
Unified Structure: All five components (Tenkan-sen, Kijun-sen, Senkou Span A/B, Chikou Span) interact to confirm or filter signals.
What Are the Strengths of Moving Averages in Trading?
Moving Averages are minimalist and efficient, making them popular in algorithmic and beginner trading strategies:
-
Simplicity: Easy to understand and implement, especially for new traders starting with trend-following strategies.
-
Automation-Friendly: Common in automated systems and Expert Advisors (EAs) due to predictable crossover logic (e.g., Golden Cross, Death Cross).
-
Effective in Breakout and Crossover Systems: MAs work well in identifying trend initiation, especially in trending markets like forex or commodities.
What Are the Drawbacks of Each Tool?
Each tool comes with limitations, depending on trader experience and market conditions:
-
Ichimoku:
-
Complexity: The five-line system and cloud structure can be overwhelming for beginners.
-
Learning Curve: Misinterpretation of Kumo width or false crossovers can lead to poor entry timing without adequate training.
-
-
Moving Averages:
-
Lag and Noise: MA signals often lag behind price action, especially during volatile or choppy markets.
-
False Signals: Susceptible to whipsaws in sideway conditions, especially with short-term MAs (e.g., MA 10 or 20).
-
Should You Use Ichimoku or Moving Averages for Different Trading Strategies?
Choosing between Ichimoku Kinko Hyo and Moving Averages (MAs) depends on the specific trading strategy whether it’s trend following, scalping, or long term investing. Each tool has strengths tailored to different timeframes and decision making processes, and understanding their suitability can significantly enhance trading precision.
Which Tool Is More Effective for Trend-Following Strategies?
Both Ichimoku and MAs are useful, but they serve trend identification differently.
-
Ichimoku excels in trend-following by offering multi-layer confirmation through the Kumo Cloud, Tenkan-Kijun crossovers, and Chikou Span. The system allows traders to detect and ride strong trends while filtering out minor retracements.
-
Moving Averages like the MA200, MA50, and EMA9 are effective in building clean crossover systems. The Golden Cross (MA50 over MA200) remains a widely accepted bullish signal in both forex and equities.
According to a study by the University of Tokyo, Quantitative Trading Research Unit (2021), Ichimoku delivered more accurate trend continuation signals on the 4H and Daily timeframes compared to dual MA systems during periods of low volatility.
Which Tool Is Better for Scalping?
EMA-based strategies are preferred for scalping over Ichimoku.
-
EMA (e.g., EMA9 or EMA21) responds quickly to price changes and is widely used on M5/M15 timeframes. Scalpers prefer EMA cross strategies for fast execution and clear signals in short-term moves.
-
Ichimoku, while powerful, becomes too complex and delayed in fast-moving lower timeframes due to its forward projection and multiple filters.
Findings from Stanford University’s Financial Data Lab (2022) show that EMA-based systems achieved faster execution and higher win rates (62%) in scalping compared to Ichimoku, which performed better on longer timeframes.
What Is the Optimal Choice for Position Trading?
Ichimoku is more comprehensive, but long-term MAs remain effective.
-
Ichimoku provides a full-market perspective by analyzing trend strength, support/resistance, and future projections, making it highly effective for long-term trade planning.
-
MA200 and MA50 are widely used in equity and forex markets to define major trend direction. These levels often act as dynamic zones where institutional traders make long-term decisions.
The London School of Economics (2020) confirmed that Ichimoku signals held longer trend accuracy on Daily/Weekly charts, while MAs offered simpler but less adaptive trend tracking suitable for conservative position traders.
Should You Combine Ichimoku and Moving Averages?
Combining Ichimoku Kinko Hyo with Moving Averages (MA) can enhance trend analysis and trade precision when applied thoughtfully. Although each tool offers independent value, many professional traders integrate them strategically to reduce ambiguity and strengthen signal confirmation.
Do Professional Traders Use Both Tools Together?
Yes, experienced traders often use both Ichimoku and MA to complement each other’s strengths.
-
Ichimoku is typically used to identify the dominant trend, leveraging the Kumo cloud, Tenkan/Kijun dynamics, and Chikou Span positioning.
-
Moving Averages, especially EMAs, are applied to refine entry timing, track momentum shifts, or manage trailing stop-loss levels.
Research from the Frankfurt School of Finance & Management (2021) found that multi-indicator strategies, particularly those combining cloud-based systems and trend-following MAs, showed a 23% improvement in entry precision without increasing drawdowns.
What Are Common Ways to Combine MA with Ichimoku?
The most popular methods involve momentum confirmation and signal layering:
-
EMA20 or EMA50: These are overlaid on Ichimoku charts to assess short- to mid-term momentum. A bullish price break above both the Kumo cloud and the EMA line is treated as a high confidence entry.
-
Breakout Validation: MA crossovers are used to confirm Ichimoku cloud breakouts, especially when Tenkan-Kijun crosses align with price crossing EMA lines.
A case study from the University of Sydney, School of Quantitative Trading (2022) demonstrated that adding EMA filters to Ichimoku based systems reduced false breakouts in ranging markets by 31%.
What Should Traders Watch Out for When Combining Both Tools?
While the combination can be powerful, improper use may create redundancy or confusion.
-
Avoid Functional Overlap: Don’t use both tools for the same purpose (e.g., trend direction). Let Ichimoku define trend context, and MA handle entry momentum or SL trailing.
-
Consistent Timeframes: Ensure both indicators are used on the same timeframe to maintain alignment and avoid conflicting signals.
The Tokyo Financial Research Institute (2020) warns that indicator overload can dilute decision clarity. Using Ichimoku for macro structure and MA for micro triggers ensures each tool serves a distinct analytical role.
Ichimoku and Moving Averages have their strengths — Ichimoku for depth, Moving Averages for simplicity. Your choice depends on whether you prefer detailed analysis or a cleaner chart. On XM, both are available and can be combined for stronger confirmation. The key is aligning the tool with your strategy and time horizon, as highlighted in the About Us XM section.

Lina Vexley is a forex education specialist with a passion for guiding new traders. She offers step-by-step lessons on MetaTrader and risk control, making XM accessible and practical for traders of all experience levels. Email: [email protected]