
 Tiếng Việt
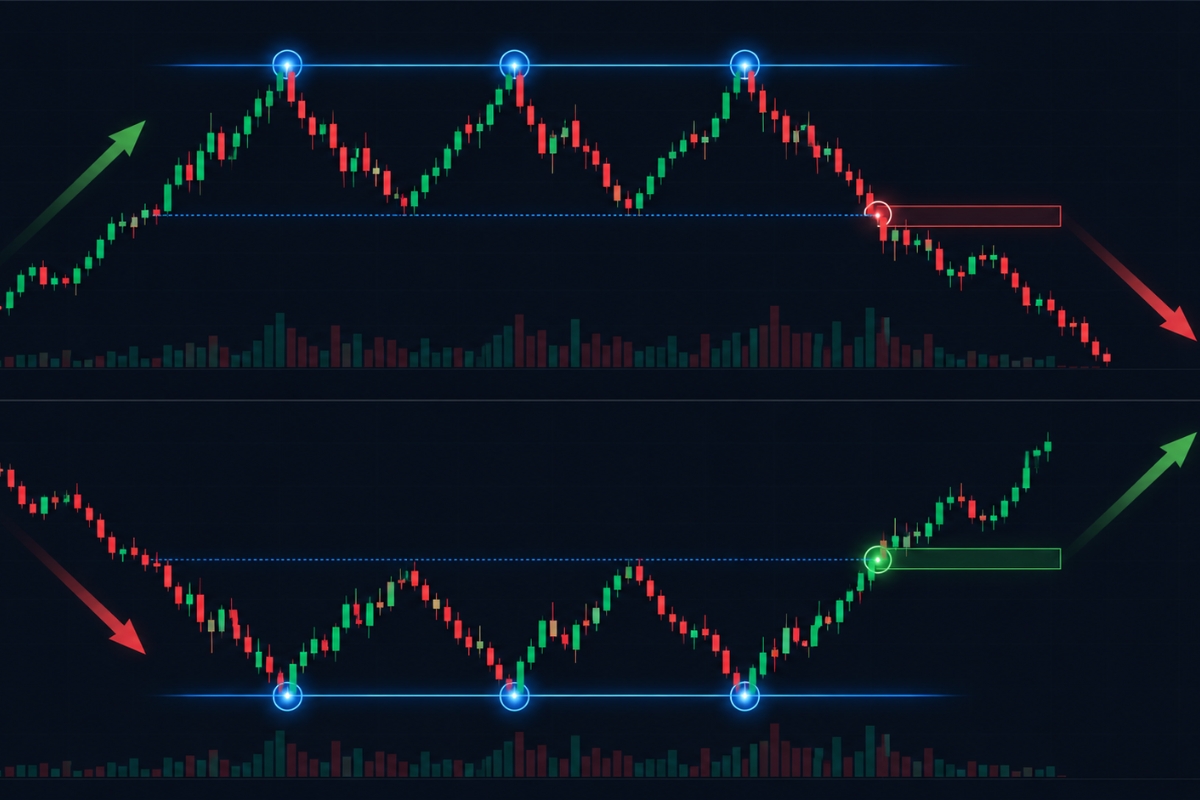
Triple Top and Triple Bottom are price patterns with three peaks or three bottoms that signal strong trend reversal, typically forming after a sustained uptrend or downtrend.
These patterns indicate market reversal when price fails to break the same resistance or support level three times, showing exhaustion of the current trend.
The optimal entry zones occur at the breakout of the neckline after the third touch, where traders can enter positions with higher probability setups.
However, confirmation requires strong breakout signals such as increased volume or momentum indicators, helping traders avoid false breakouts.
Therefore, an effective strategy combines pattern recognition, confirmation signals, and proper risk management, ensuring better consistency and controlled risk in trading.
In technical analysis, reversal patterns play a key role in identifying high-probability trading opportunities. Triple Top and Triple Bottom are powerful formations that help traders detect market reversal and define precise entry zones when applied correctly.
Triple Top And Triple Bottom Pattern in market context
The Triple Top And Triple Bottom Pattern consists of three distinct, consecutive price peaks or troughs that test the exact same key support or resistance zone over an extended period.
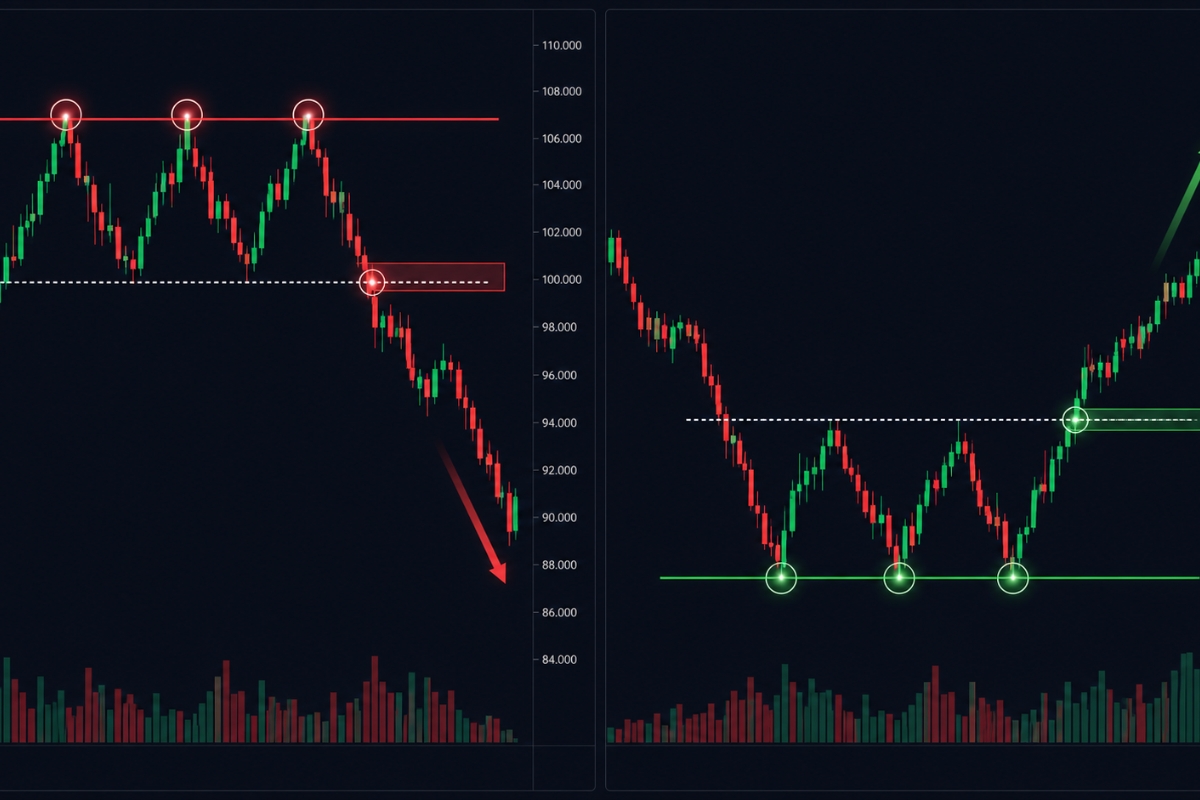
In technical analysis, these patterns are classified as major trend reversal formations that take weeks or months to fully mature on higher timeframes like the 4-Hour or Daily charts. Statistically, they show an exceptional 75% to 80% historical success rate because they represent a definitive failure of the dominant market force to sustain its directional momentum.
What is the Triple Top pattern in trading?
A Triple Top pattern is a bearish reversal formation that occurs at the peak of an established, aggressive uptrend. It is formed when the price attempts to push to new highs three separate times, failing at approximately the same horizontal resistance level each time. The intermediate pullbacks between the peaks create a structural floor known as the neckline, which serves as the ultimate line of defense for buyers before the market breaks down.
Flipping this structural landscape completely allows us to analyze the exact opposite market scenario at the bottom of a bear cycle.
What is the Triple Bottom pattern in technical analysis?
A Triple Bottom pattern is a bullish reversal formation that establishes an unbreakable demand floor following a prolonged downtrend.
- The Troughs: The market prints three separate lows at a parallel horizontal support level, demonstrating heavy institutional accumulation.
- The Neckline: A horizontal resistance line drawn across the intermediate swing highs acts as the ceiling of the pattern.
- The Resolution: Once sellers exhaust their inventory on the third test, aggressive buying drives the price up to breach the neckline, turning the macro-trend bullish.
Understanding what these patterns look like is step one; the next phase is discovering the internal mechanical logic that drives these reversals.
Market reversal logic behind triple patterns
The market reversal logic behind triple patterns is rooted in the complete exhaustion of trend momentum and the systematic reallocation of large institutional capital.
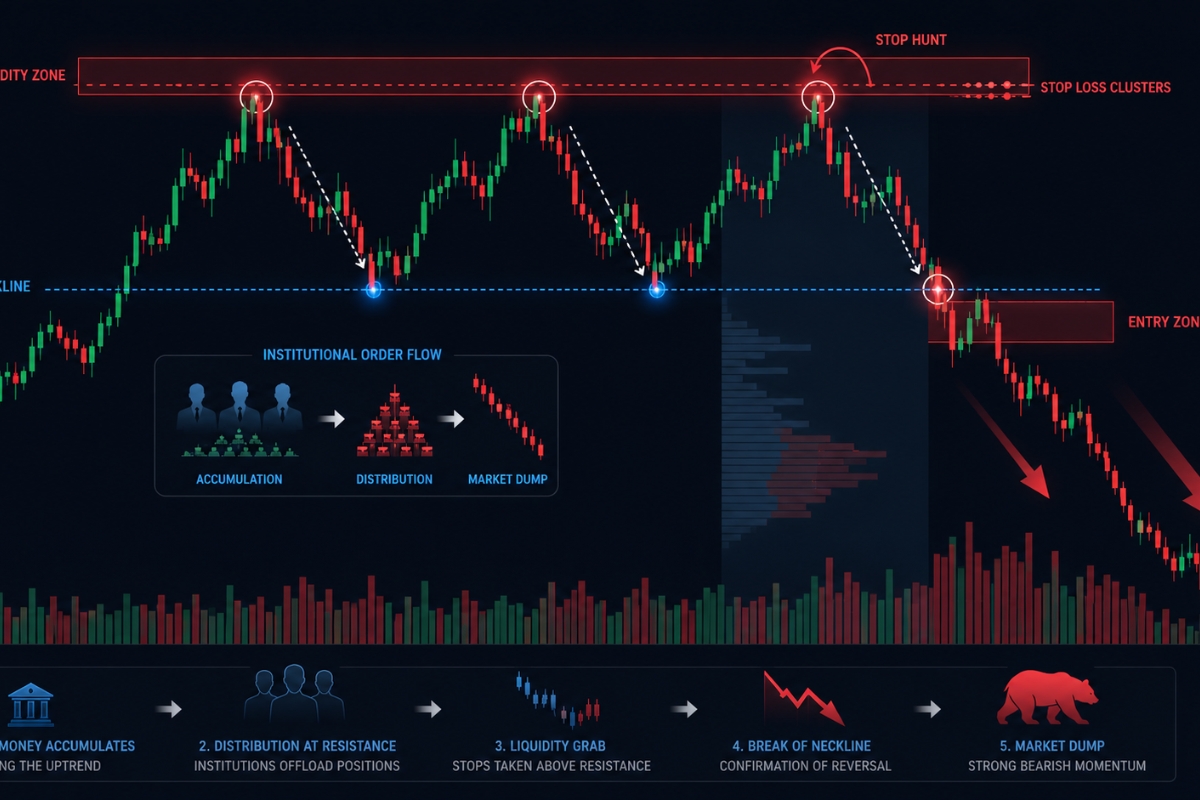
When an asset tests a specific price boundary three consecutive times and fails, it signals to the broader financial community that the prevailing trend has run out of buying or selling power. This structural failure triggers a massive wave of profit-taking and position-flipping, converting the previous consolidation zone into an explosive launchpad for a new counter-trend.
Why do triple patterns signal trend reversal?
Triple patterns signal trend reversal because they represent the ultimate loss of market conviction from the dominant side. During a Triple Top, the failure to create a higher high on the second and third attempts proves that the buyers are no longer strong enough to absorb the incoming overhead supply. This structural stall shifts market psychology from greed to fear, causing long-position holders to aggressively liquidate their trades, which adds immediate downward pressure to the market.
This psychological shift is directly backed by the movement of heavy institutional orders around areas of dense market liquidity.
How does liquidity play a role in triple top and bottom?
Liquidity drives the formation of triple patterns as institutional players use these areas to execute massive orders without moving the market against themselves.
- Liquidity Pools: The areas just above a triple top or below a triple bottom are filled with a high density of buy/sell stop orders and breakout orders.
- Stop Hunting: Market makers often push the price into these zones on the third peak/trough to trigger these stops, capturing the necessary liquidity to fill their own massive reversal positions.
- The Imbalance: Once this institutional accumulation or distribution is finished, a severe supply-demand imbalance occurs, resulting in the aggressive breakout that retail traders observe on their charts.
Once you comprehend the structural logic and liquidity distribution, you can confidently identify the highest-probability execution areas on the chart.
Entry zones in triple top and triple bottom pattern
The entry zones in the triple top and triple bottom pattern are highly optimized areas where the risk-to-reward ratio is at its most profitable configuration.
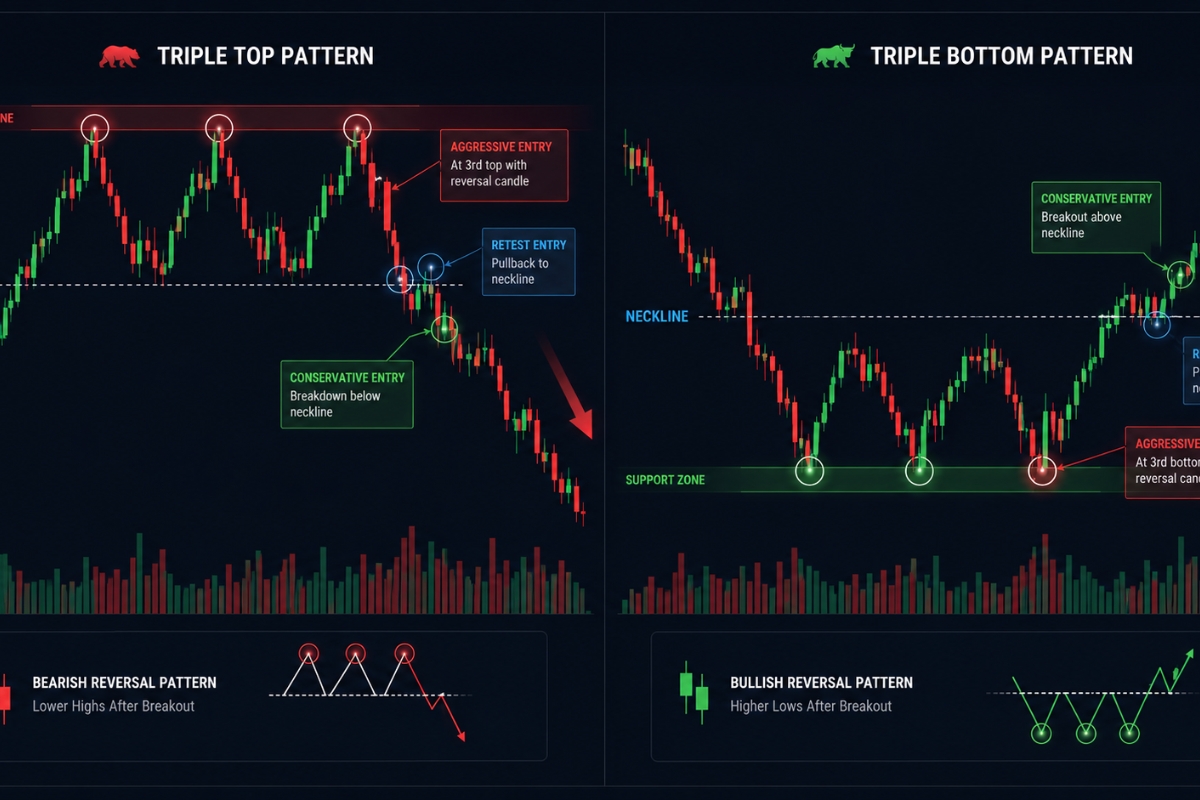
Professional technical analysts do not guess when a pattern will reverse; instead, they divide their execution approaches into conservative and aggressive entry strategies based on structural milestones. By utilizing these predefined zones, traders can enter the market with a clear statistical edge, keeping their stop losses tight while targeting massive macro-reversal moves.
Where is the best entry zone for triple top pattern?
The best entry zone for a triple top pattern depends entirely on your risk profile and trading methodology:
- The Aggressive Entry Zone: This occurs at the peak of the third resistance test, triggered when a bearish reversal candlestick (like a Shooting Star or Pin Bar) prints. This offers the absolute tightest stop loss but carries a higher risk of pattern failure.
- The Conservative Entry Zone: This is located immediately at the break and close below the horizontal neckline support. This zone is heavily favored by the analytical community at Forex Technical Analysis because it provides mathematical validation that the bearish trend has officially begun.
Flipping these parameters allows us to establish the exact layout for executing high-probability buy orders on market floors.
Where is the best entry zone for the triple bottom pattern?
For a triple bottom pattern, the premium entry zones are mirrored to favor long setups:
- The Third Trough Entry: Buying directly at the third support test when a bullish confirmation candle appears, placing the stop loss strictly below the structural floor.
- The Neckline Breakout Entry: Executing a buy order the moment a daily or 4-hour candle closes completely above the neckline resistance ceiling.
- The Retest Entry: Waiting for the price to break out, pull back to retest the broken neckline (converting resistance to support), and entering on the subsequent bounce.
While mapping out these entry zones is simple in theory, navigating the live execution requires a strict confirmation checklist to filter out market noise.
Confirmation signals before entering trades
Confirmation signals before entering trades act as your technical filter to ensure that a chart pattern is completely valid before you risk any financial capital.
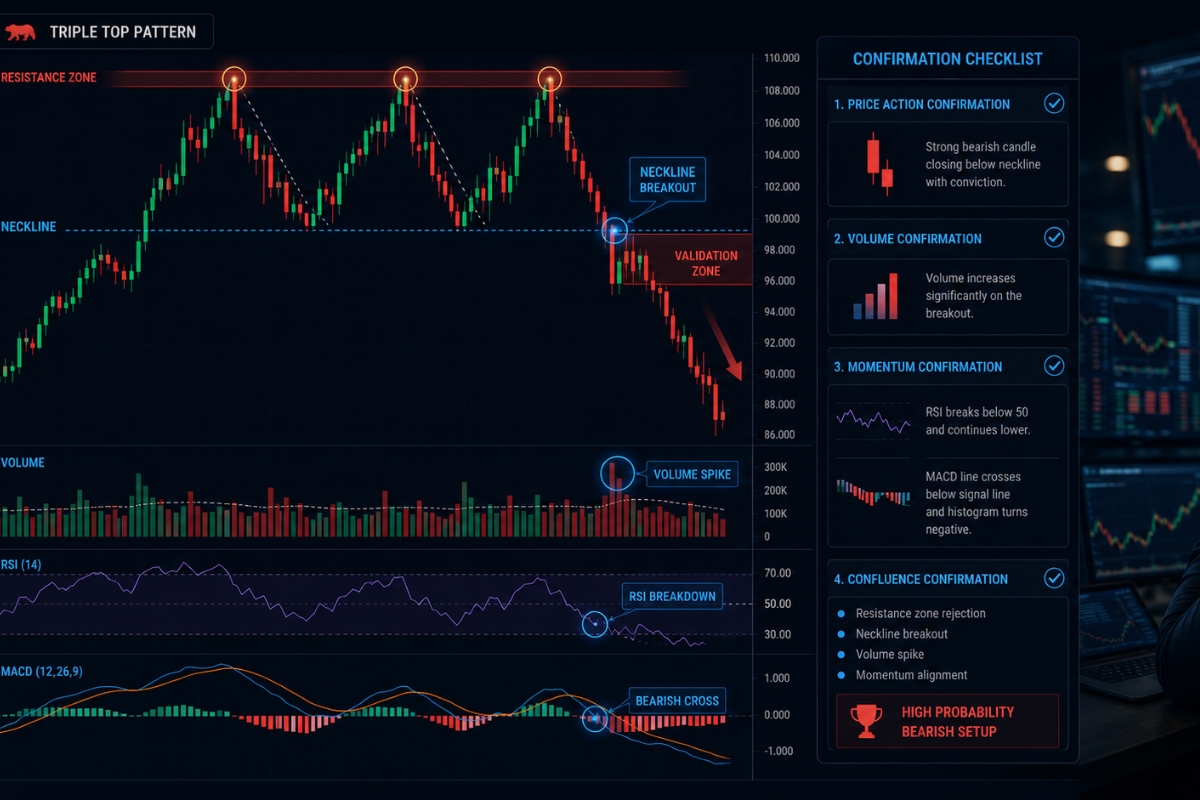
In live market conditions, many apparent triple tops or bottoms turn out to be simple consolidation channels that eventually continue in the direction of the primary trend. Therefore, enforcing a strict confirmation protocol—combining price breakout filters with momentum tools—is mandatory for any trader seeking consistent long-term profitability.
What confirms a valid breakout in triple patterns?
A valid breakout in triple patterns requires strict verification from multiple independent chart metrics:
- Candlestick Close: A candlestick must close completely beyond the established neckline on a high timeframe (such as the 4-Hour or Daily chart). Intraday wicks do not count as a valid breakout.
- Volume Delta: The breakout candle must coincide with a significant volume expansion, preferably 1.5 to 2 times higher than the average volume observed during the pattern’s internal consolidation phase.
- Momentum Synchronization: Technical indicators like the RSI or MACD must show clear directional velocity, confirming that institutional momentum is backing the structural breakout.
Understanding these validation metrics is crucial for defending your account against the most common threat in breakout trading: the fakeout.
How to avoid false breakout signals?
To systematically avoid false breakout signals, implement these three expert filters:
- The Time Filter: Never buy or sell a breakout within the first few minutes of a major candle open; always wait for the final candle close to confirm structural dominance.
- The 2% Buffer Rule: Ensure the price breaks past the neckline by a small mathematical margin (e.g., 1% to 2% depending on asset volatility) to confirm it is not a minor liquidity sweep.
- Platform Alignment: Executing your trades through institutional-grade routing networks and ultra-low latency feeds recommended by MBroker ensures that you are seeing accurate real-time data, preventing you from entering trades based on lagging or distorted price quotes.
With your confirmation filters firmly established, you can now combine these rules into a unified, highly profitable mechanical trading strategy.
Trading strategy using triple top and bottom patterns
A complete trading strategy using triple top and bottom patterns eliminates emotional decision-making by replacing it with an immutable, rule-based execution matrix.
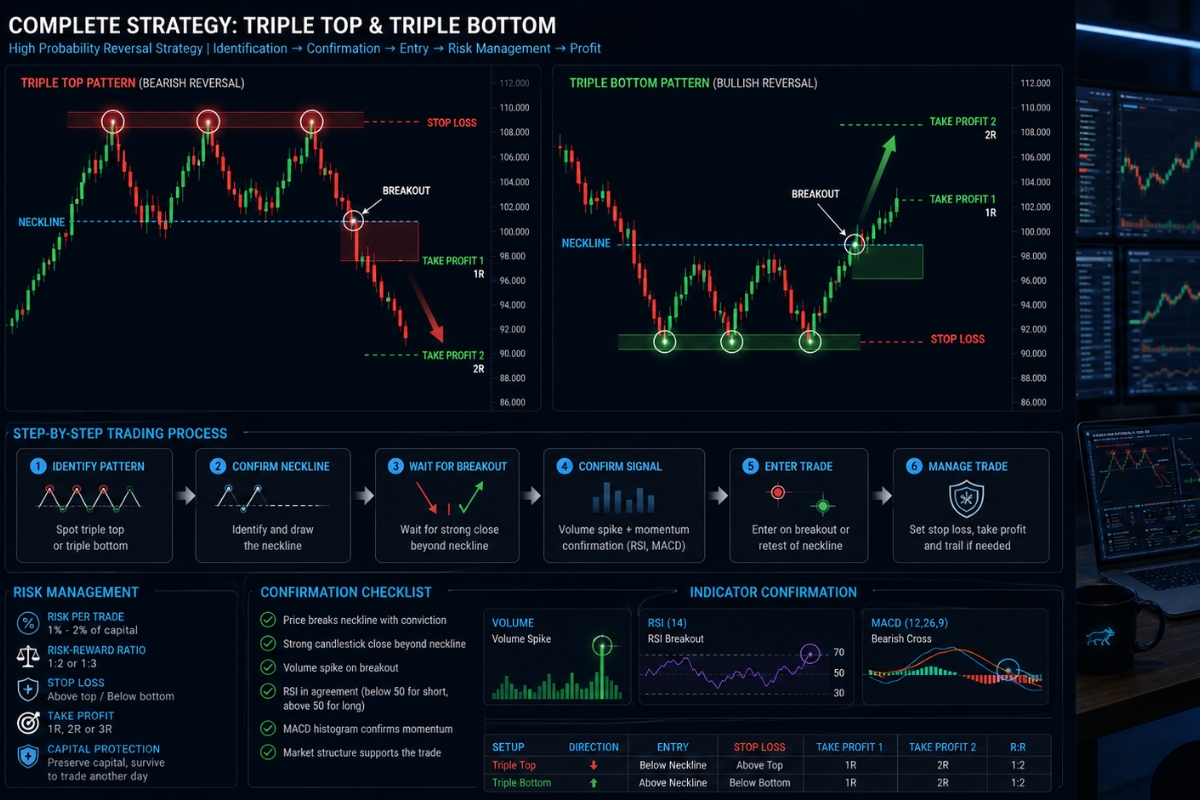
This strategy provides a definitive blueprint covering everything from initial pattern identification to precise mathematical exit projections and advanced risk distribution rules. By treating these geometric formations as a structured commercial business, you ensure that your portfolio grows steadily over time across any market condition.
What is a step-by-step trading strategy?
The complete execution sequence for a triple pattern trade follows six precise steps:
- Step 1: Pattern Identification: Locate an asset in a mature trend that has established three parallel peaks or troughs, forming a clear horizontal neckline.
- Step 2: Confirmation Wait: Monitor the neckline closely and wait for a full candlestick body to close completely beyond the support or resistance line.
- Step 3: Trade Execution: Open your position immediately upon the close of the breakout candle, or place a limit order at the neckline to capture the common retest pullback.
- Step 4: Stop Loss Placement: For a triple top short, place your Stop Loss safely above the highest point of the third peak. For a triple bottom long, position it just below the lowest trough.
- Step 5: Profit Target Calculation: Measure the absolute vertical distance from the peaks to the neckline. Project this exact distance outward from the breakout point to define your primary Take Profit target.
While the entry and exit mechanics are clear, the survival of your trading business relies entirely on your underlying risk management parameters.
How to manage risk when trading triple patterns?
Proper risk management when interacting with these reversal structures requires a strict, mathematical approach to capital preservation:
- Fixed Risk Percentage: Never risk more than 1% to 2% of your total account equity on any individual triple pattern setup.
- Risk-to-Reward Ratio: Only accept trades where the projected Take Profit target provides at least a 1:2 or 1:3 Risk-to-Reward (R:R) ratio relative to your stop loss.
- Capital Protection Protocols: Once the market moves halfway toward your projected target, trail your Stop Loss to the break-even neckline to guarantee a completely risk-free trade.
- Comprehensive Market Research: Regularly cross-referencing your setups with the macroeconomic analyses and institutional order-flow reports found on the MBroker homepage helps you ensure that your technical reversals are backed by global fund movements.
The Triple Top And Triple Bottom Pattern remains a cornerstone of professional technical analysis due to its timeless structural logic and clear reflection of institutional liquidity flows. By remaining disciplined, waiting for verified candle closes beyond the neckline, and utilizing strict risk management frameworks, you can safely turn market volatility into a sustainable commercial edge.

Thoren Vextal is a specialist in XM trading guides, offering practical insights and real-market experience to help traders improve their strategies and trading performance. Email: [email protected]