
 Tiếng Việt
The CCI Indicator measures price deviation from its average value, helping traders identify overbought, oversold conditions and market trends.
CCI reflects how far price deviates from its statistical average, allowing traders to spot opportunities when the market is overvalued or undervalued.
CCI generates buy signals when crossing above -100 and sell signals when crossing below +100, supporting traders in identifying entry and reversal points.
To use CCI effectively, it should be combined with trend analysis and other indicators, improving accuracy and reducing false signals.
CCI is highly suitable for day trading due to its fast response to price movements, helping traders capture short-term opportunities in Forex and Crypto markets.
In technical analysis, the CCI Indicator is a powerful tool that helps traders measure price deviation, identify trading signals, and optimize strategies.
CCI indicator and its role in trading
The CCI indicator plays a fundamental role in modern technical analysis by helping traders identify cyclic turns, overbought or oversold conditions, and new trend beginnings.

Developed by Donald Lambert in 1980, this momentum-based oscillator quantifies the relationship between asset price and its moving average, typically using a standard 14-period default setting. By flashing data that ranges above $$+10$$ or below $$-10$$, the indicator provides institutional-grade clarity on market velocity across all major financial asset classes.
To fully harness this tool, it is essential to break down its structural definition and understand why global market participants rely on it daily.
What is a CCI indicator in trading?
The CCI indicator is an oscillator that measures the position of an asset’s price relative to its statistical mean over a defined time tracking window. Mathematically, it calculates the “Typical Price” $$(\text{High} + \text{Low} + \text{Close}) / $$and subtracts a Simple Moving Average (SMA) of that typical price, and divides the result by the Mean Absolute Deviation. This complex calculation scales the data to ensure that roughly 70% to 80% of all price action fluctuates safely within the designated $$-10$$ and $$+10$$ boundary lines.
Understanding the mechanics of the mathematical oscillator is crucial, but its real-world utility in volatile conditions is what truly matters to investors.
Why do traders use CCI in financial markets?
Traders implement this specific oscillator because it acts as a leading indicator of momentum exhaustion, offering three distinct advantages:
- Trend Detection: It signals when a market is entering a strong, sustainable bullish or bearish phase.
- Extreme Isolation: It highlights when a price has stretched too far from its historical average, setting up potential rubber-band reversals.
- Noise Elimination: By focusing strictly on statistical deviations, it filters out the random midday price fluctuations that catch retail traders off guard.
Recognizing how the indicator measures these averages allows us to dive into its primary analytical strength: detecting severe price anomalies.
Price deviation analysis using CCI indicator
Price deviation analysis using the CCI indicator focuses on tracking how far an asset’s current valuation has drifted away from its established statistical average.
When the indicator moves outside the normal $$-10$$ to $$+10$$ range, it reveals that the market is experiencing a significant mathematical deviation from its mean. Analyzing these deep structural variances allows traders to gauge the strength of a trend and anticipate whether the current price action is sustainable or due for an immediate correction.
How does CCI represent buy and sell price levels?
The oscillator maps out potential buy and sell regions based on specific numerical thresholds:
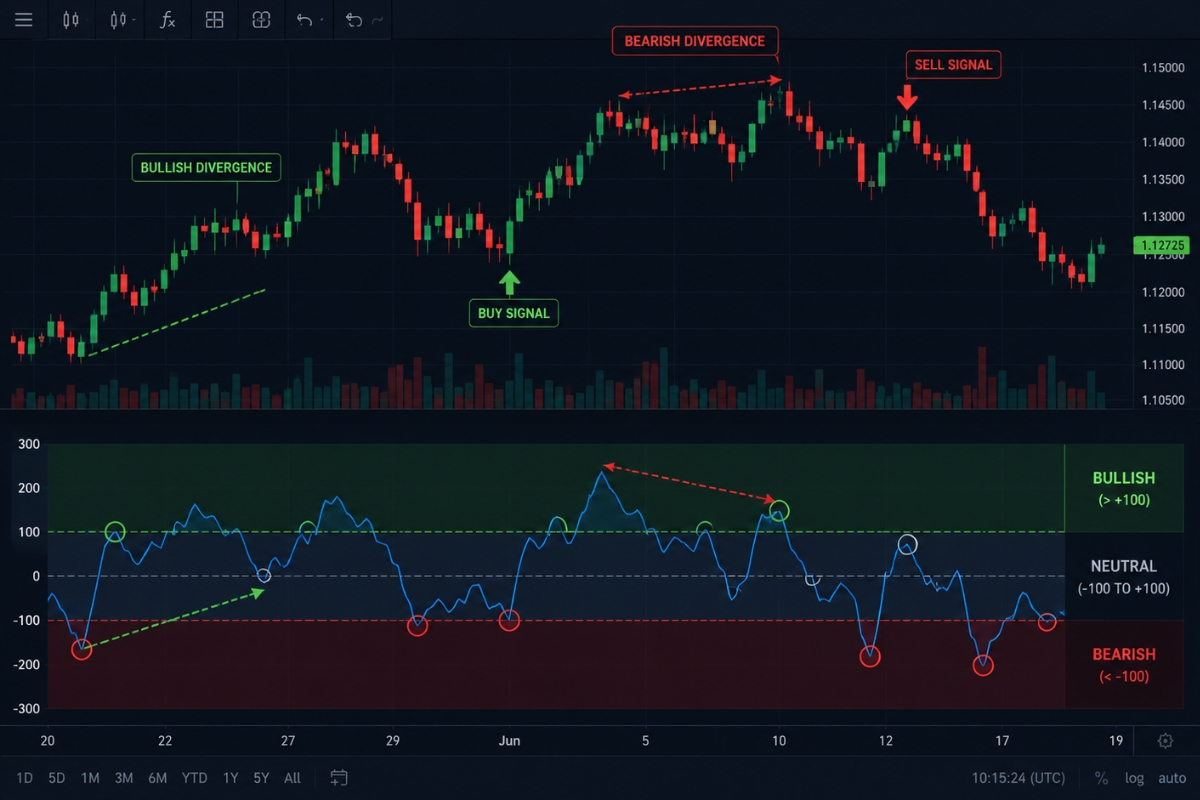
- The Bullish Zone (>+100): Indicates an overbought state or a strong upward Breakout Trading, signaling massive institutional buying velocity.
- The Neutral Zone (Between – 100 and + 100): Reflects a standard consolidation phase where the price aligns closely with its statistical average.
- The Bearish Zone (<-100): Indicates an oversold state or a strong downward breakdown, highlighting aggressive selling pressure.
Knowing where these zones lie is helpful, but true profitability comes from recognizing when these deep structural variances create low-risk entry opportunities.
When does price deviation create trading opportunities?
Price deviation creates optimal trading opportunities when the oscillator returns to its normal bounds or forms a divergence against the actual price action. For example, if a currency pair makes a new high but the oscillator fails to break its previous peak, a bearish divergence occurs, warning that the buying momentum is dying. Platforms like MBroker emphasize that these mathematical discrepancies provide high-probability turning points where retail traders can position themselves alongside institutional market makers.
Once you spot a valid structural deviation, the next step is isolating the exact signals needed to confirm an entry.
CCI indicator signals and trade confirmation
CCI indicator signals provide clear, objective entry and exit triggers based on cross-line breaches and structural chart patterns.
The most famous signal setups involve the indicator crossing back over the + 100 or – 100 thresholds, indicating that extreme market forces are beginning to normalize. However, because raw oscillator lines can occasionally fluctuate back and forth, a professional strategy requires a strict confirmation checklist to weed out bad data.
What are the main CCI trading signals?
The oscillator generates three primary trading signals that can be easily automated or read manually:
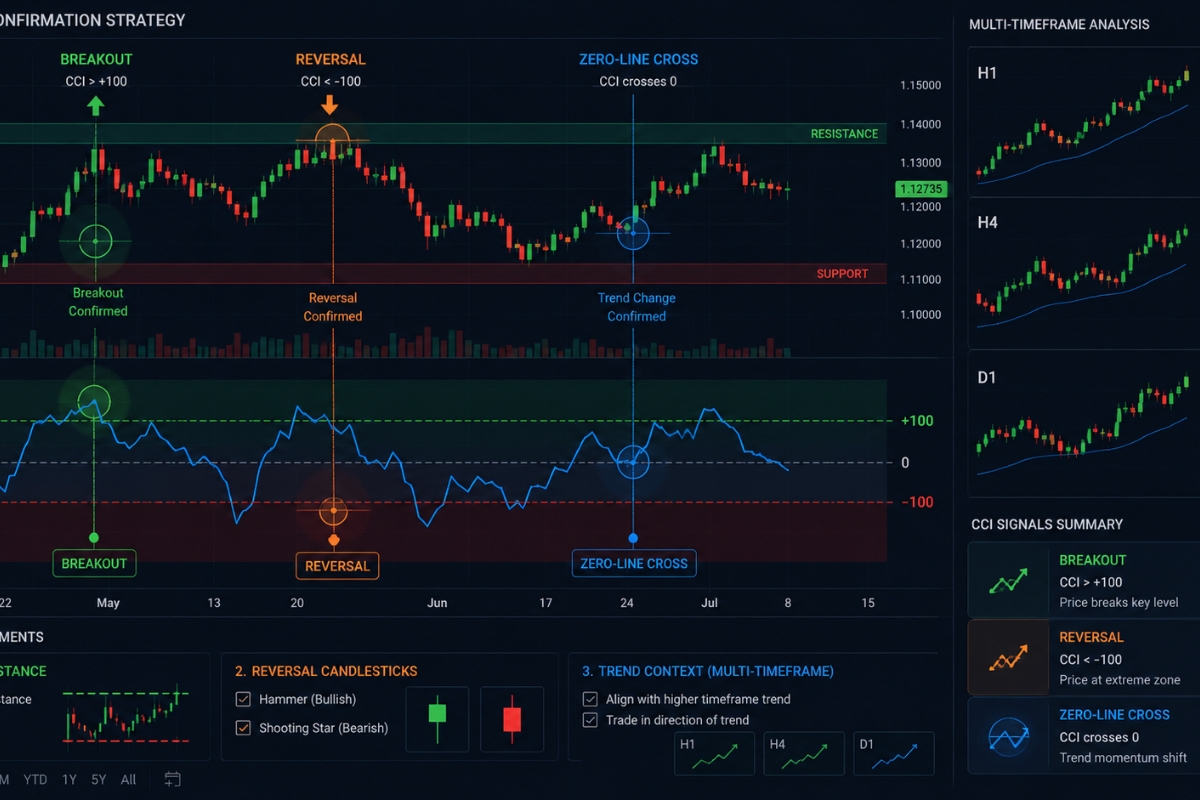
- The Breakout Signal: Buying when the line crosses above +100 (momentum trading) or selling when it drops below -100.
- The Reversal Signal: Shorting when the line falls back below $$+10$$ from an overbought state, or buying when it climbs back above -100 from an oversold floor.
- The Zero-Line Cross: Crossing above 0 signals a bullish trend shift, while crossing below 0 confirms that sellers have taken over the medium-term trend.
While these signals are powerful on their own, executing them blindly without confirmation filters can lead to catastrophic losses.
How to confirm CCI signals effectively?
To protect your trading account capital, always confirm every raw signal using multi-layered technical filters:
- Candlestick Validation: Wait for a clear reversal candle (like a Hammer or Shooting Star) to print at the exact moment the oscillator triggers.
- Support and Resistance Confluence: Only take an oversold buy signal if the asset’s price is simultaneously touching a major historical support zone.
- Multi-Timeframe Analysis: If the 1-Hour chart shows an oversold buy signal, ensure the 4-Hour trend is also pointing upward to avoid trading against the primary market flow.
With a robust confirmation checklist in place, we can now assemble these components into a fully executable trading strategy.
How to use CCI indicator in trading strategies?
Learning how to use the CCI indicator inside a rule-based strategy transforms a basic visual chart tool into a scalable, high-probability business framework.

A disciplined system ensures that entries are executed based on strict structural laws rather than gut feelings or emotional biases. By defining exact entry triggers, clear stop-loss locations, and realistic, data-driven profit targets, you can consistently exploit market inefficiencies over the long term.
What is a step-by-step method to use CCI indicator?
To use the CCI indicator effectively, follow a simple step-by-step approach to set it up and interpret signals within your trading strategy.
- Step 1: Setup: Apply the standard 14-period CCI to a clean 1-Hour or 4-Hour chart.
- Step 2: Monitor: Wait for the oscillator line to move beyond the $$+10$$ or $$-10$$ boundaries.
- Step 3: Trigger: Execute a trade when the line crosses back inside the normal zone (e.g., crossing above $$-10$$ for a buy).
- Step 4: Stop Loss: Place your Stop Loss safely below the recent swing low (for buys) or above the recent swing high (for shorts).
- Step 5: Take Profit: Exit the trade when the indicator reaches the opposite extreme or crosses past the zero line.
While this standalone method is highly effective, combining it with complementary indicators creates an even more resilient trading system.
How to combine CCI with other indicators?
To minimize false entries, combine the oscillator with a trend-following tool and a volume metric:
- CCI + Moving Averages: Only accept buy signals when the price is trading above a 200-period Exponential Moving Average (EMA).
- CCI + Bollinger Bands: Execute shorts when the line drops below $$+10$$ while the price is simultaneously rejecting the upper Bollinger Band.
- Synergistic Execution: Combining these methods with the institutional data feeds and analysis provided in the XM Guide ensures that your strategy remains aligned with major global capital allocations.
Now that the core strategy is optimized, let’s explore how to adapt these rules for the fast-paced world of intraday day trading.
CCI indicator for day trading strategies
The CCI indicator for day trading strategies is highly favored by intraday professionals due to its exceptional sensitivity to rapid, short-term price adjustments. In day trading, where positions are opened and closed within the same session, the indicator is typically loaded onto smaller timeframes like the 5-minute or 15-minute charts.

Its ability to rapidly detect shifts in momentum allows day traders to capture quick price runs during peak market hours while keeping their risk parameters tight.
How to use CCI for day trading effectively?
To maximize your day trading performance, adjust the period setting downward to 20 or 50 to filter out low-timeframe market noise. Focus your execution strictly during the highly liquid market openings:
- The London Session Open: Watch for quick momentum breakouts above $$+10$$ as institutional volume floods the market.
- The New York Open: Use the zero-line cross to ride short-term intraday trends on high-volume stock indexes or currency pairs.
- Risk Control: Always close all positions before the daily session wrap-up to avoid overnight funding fees and gap risks.
Understanding how to navigate these shorter windows allows day traders to deploy the tool successfully across multiple global financial networks.
Is CCI suitable for forex and crypto day trading?
Yes, the indicator is highly suitable for both Forex and Cryptocurrency day trading, though each market requires a slightly different approach:
- In Forex Markets: The oscillator is exceptionally stable because major currency pairs exhibit high liquidity and clear mean-reverting behavior, allowing oversold/overbought boundaries to hold firmly.
- In Cryptocurrency Markets: The tool is highly profitable for capturing massive, momentum-driven breakout runs. However, because crypto assets suffer from extreme volatility, day traders at MBroker are advised to use wider stop-loss margins and rely heavily on volume confirmation to survive sudden liquidity flushes.
In conclusion, the CCI Indicator stands as an elite technical tool that offers unprecedented clarity into market momentum, trend acceleration, and extreme price deviations. By executing trades on confirmed boundary crossings, combining the oscillator with strong trend-following filters, and maintaining disciplined risk sizing, you can build a highly repeatable trading edge.

Thoren Vextal is a specialist in XM trading guides, offering practical insights and real-market experience to help traders improve their strategies and trading performance. Email: [email protected]