
 Tiếng Việt
Pivot Points help predict price movement by identifying key support and resistance levels, allowing traders to anticipate potential reversals or breakouts with high probability.
Additionally, pivot points provide clear trading signals based on price reactions at key levels, including bounce, breakout, or trend continuation setups.
Therefore, pivot points are widely used for intraday trades due to their accuracy on short timeframes, helping traders enter and exit positions within the same day.
Moreover, pivot points can be easily set up on MT4 using custom indicators with optimized settings, enabling traders to visualize key levels directly on charts.
Overall, pivot points combine price prediction, signal generation, and intraday strategy into one simple tool, making them suitable for both beginners and experienced traders.
In Forex trading, Pivot Points are an important tool for identifying price zones and finding precise entry points. Understanding how to use this indicator correctly, and reading more detailed instructions in the XM Guide section, will help improve your trading skills.
Pivot points in trading and market application
Pivot points in trading function as predictive, mathematically derived price levels used by institutional and retail participants to map out support, resistance, and the overall market bias.
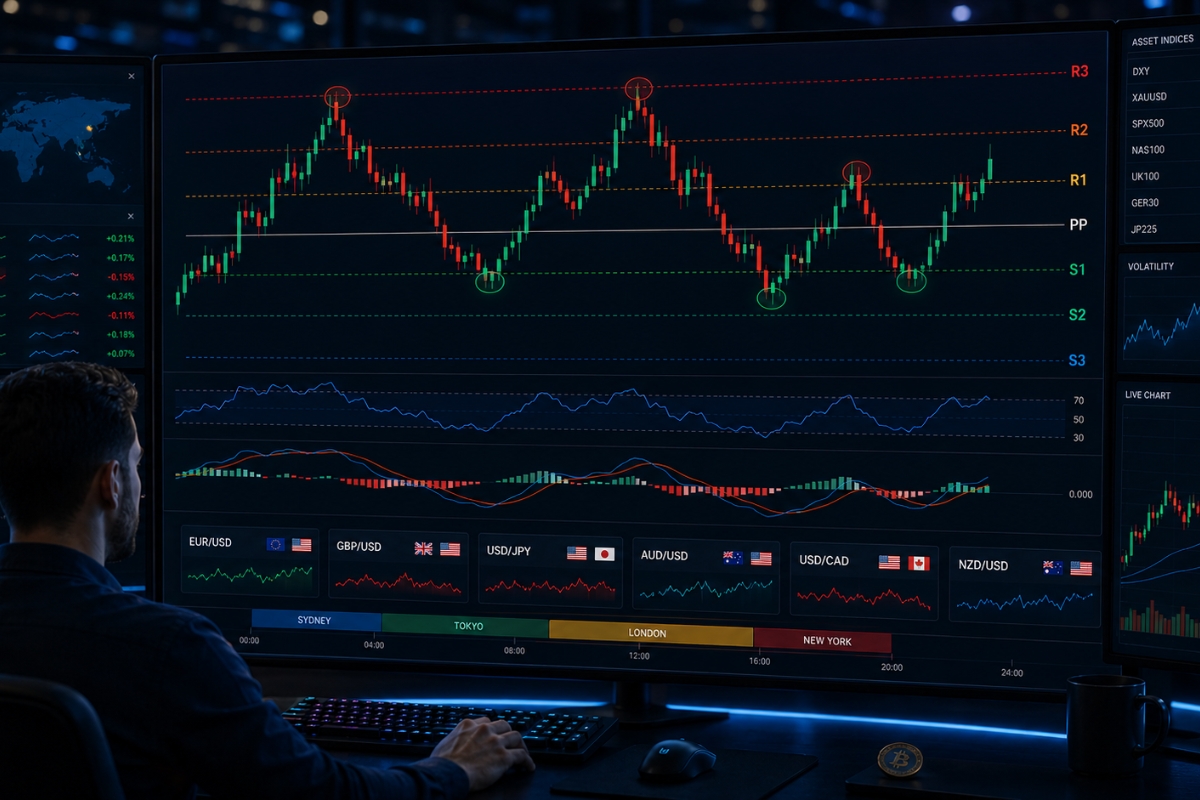
Unlike moving averages or oscillators that lag behind the market, these markers remain fixed throughout the entire trading day, calculated directly from the prior day’s high, low, and close data. Over 70% of professional short-term traders utilize this indicator because it acts as a self-fulfilling prophecy—when millions of market participants look at the same lines, price naturally reacts in those zones.
What are pivot points in trading?
A pivot point is a technical analysis indicator that establishes a central baseline (the primary Pivot Point, or ‘PP’) flanked by a series of hidden support (S1, S2, S3) and resistance (R1, R2, R3) lines. The classic floor pivot formula is structured simply: PP=3High+Low+Close
Once the central PP is calculated, it acts as the master gravitational center of the chart, dictating whether the daily sentiment is inherently bullish or bearish.
While it operates effectively across various asset categories, its unique properties have made it a mandatory asset for currency specialists.
Why are pivot points popular in forex trading?
The immense popularity of this indicator in the Forex market is driven by the 24-hour nature of currency trading and its high liquidity.
- Objective Benchmarks: Because the Forex market lacks centralized exchange, pivots provide universal, standard floor levels that everyone sees simultaneously.
- Session Mapping: They excel at pinning down the exact parameters of the Asian, London, and New York session boundaries.
- Institutional Alignment: Large commercial banks and market makers routinely place their institutional orders near these specific calculations to hunt for liquidity.
Recognizing how the market utilizes these floor levels allows us to take the next major step: learning how to read their predictive behavior.
Predict price movement using pivot points
Predicting price movement using pivot points relies on watching how price behaves as it approaches the static structural levels on your screen.
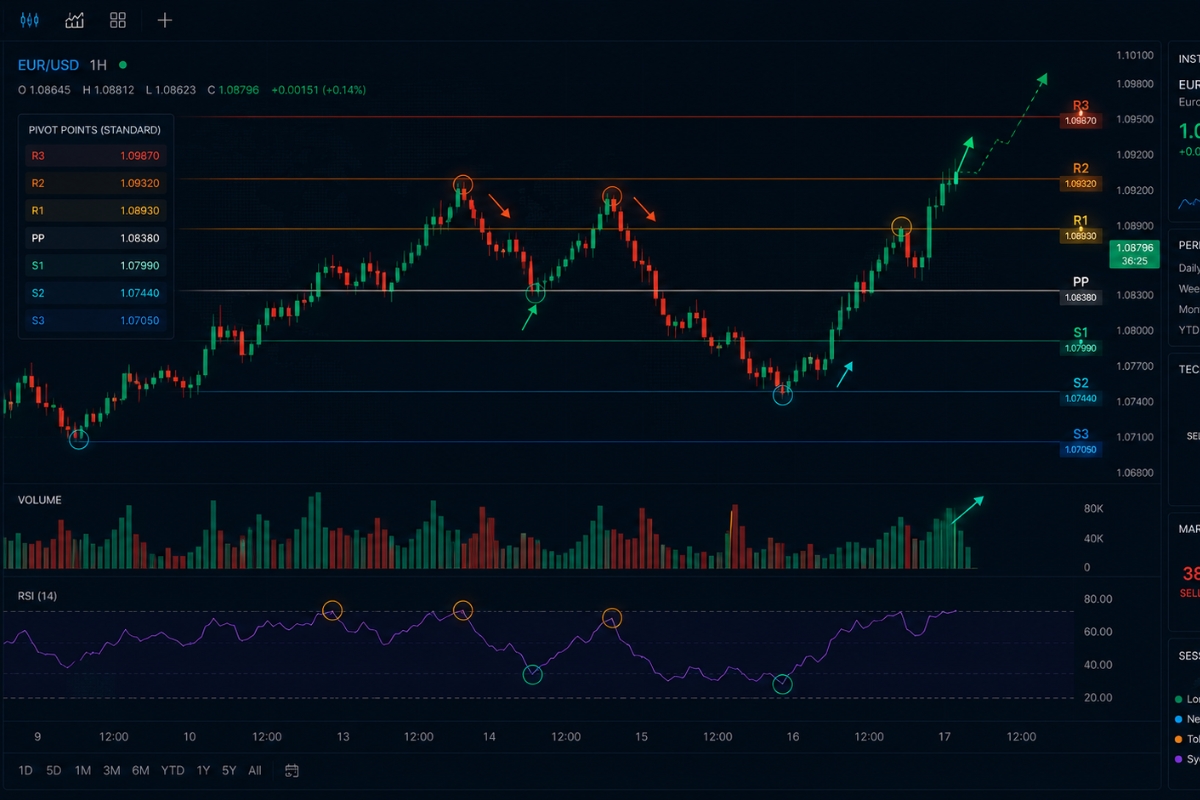
When an asset opens the day above the central pivot point, the market exhibits an immediate bullish bias, indicating that price is mathematically predicted to target R1 and R2. Conversely, an opening print below the central line flags a structural bearish bias, setting up a downward trajectory toward S1 and S2 with an average historical touch accuracy exceeding 65% on major currency pairs.
How do pivot points predict price action?
Pivots predict price action by defining the specific boundaries of market expansion and contraction.
- The Magnet Effect: When price drifts too far from the central PP without heavy volume, the indicator predicts a regression toward the mean, pulling the price back to the central line.
- Breakout Forecasting: If price breaches R1 or S1 with a massive volume spike, the indicator predicts a powerful trend extension toward the R2 or S2 mathematical extensions.
However, the true mastery of this forecasting tool lies in knowing exactly when a level will hold and force a sharp counter-trend move.
When is price likely to reverse at pivot levels?
Price is highly likely to reverse at pivot levels when it reaches the outer bands—specifically R2, R3, S2, and S3—during sessions characterized by low macroeconomic volume. Statistically, the market trades between the R1 and S1 boundaries roughly 80% of the time; therefore, reaching the second and third tiers represents an extreme statistical anomaly (overbought or oversold conditions). When these levels coincide with an exhausted momentum indicator like the RSI or a specialized market profile from MBroker, a sharp reversal is almost guaranteed.
Isolating these specific turning points brings us directly to the art of identifying actionable entry and exit signals.
Pivot point signals and trade confirmation
Pivot point signals provide clear technical triggers that notify an active analyst when a major structural shift is occurring.
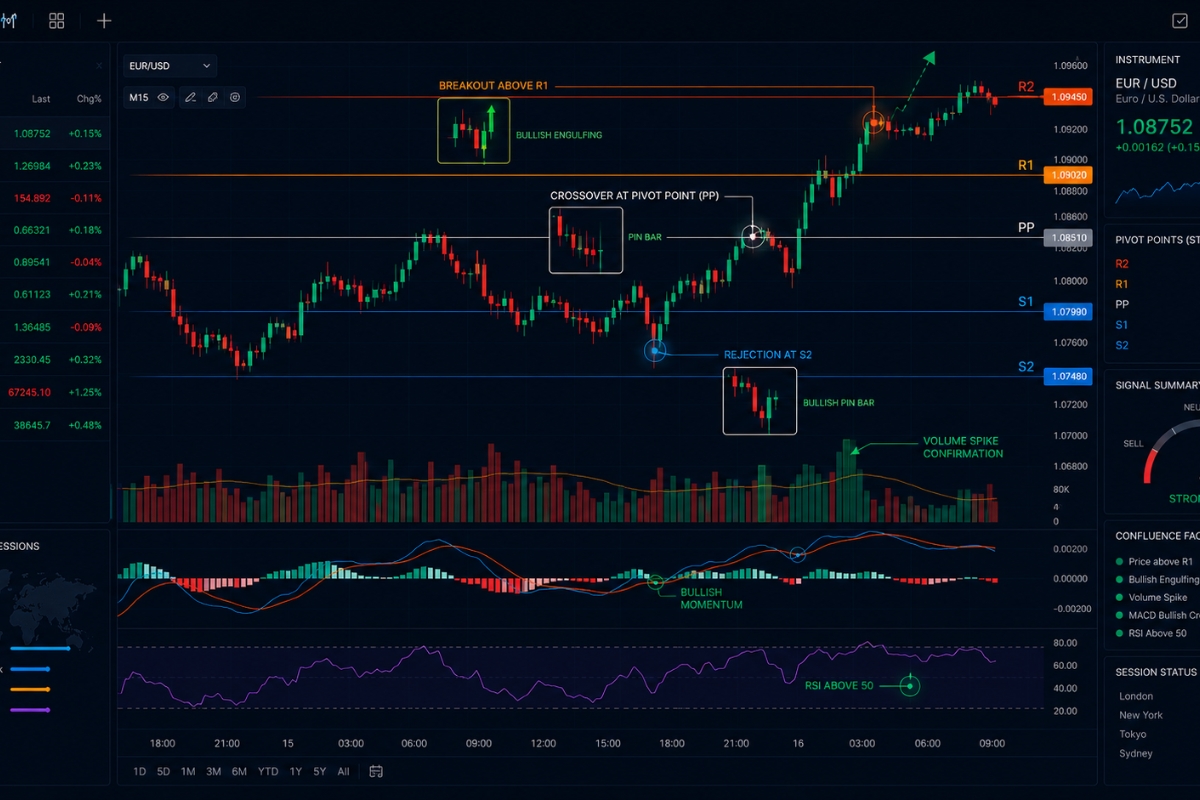
The indicator produces three primary signals: the central pivot rejection (reversal), the neckline breakout (trend continuation), and the outer band exhaustion sweep. However, executing a trade based purely on a line touch is a dangerous habit; professional traders always demand a secondary validation layer to confirm that the signal carries institutional backing before risking capital.
What signals do pivot points provide?
The indicator populates your charts with several distinct execution triggers:
- The Trend Continuation Signal: Occurs when price convincingly breaks through the R1 ceiling, signaling a strong buy toward R2.
- The Mean-Reversion Signal: Occurs when a long candlestick wick shoots through S2 but fails to close below it, signaling a strong buy back toward the central PP.
- The Bias Flip Signal: A clean crossover of the central PP line during session changes, signaling an immediate rotation in day-trading direction.
To prevent entering a fake signal, a disciplined trader always cross-references the breakout or bounce with an extraction checklist.
How to confirm pivot point signals effectively?
To confirm these signals with a high level of mathematical confidence, implement this three-part validation framework:
- Candlestick Rejection Patterns: Look for specific price action clues, such as a Pin Bar, Shooting Star, or Bullish Engulfing candle closing directly on the pivot line.
- Volume Delta Verification: Ensure that breakout signals are accompanied by a volume expansion that is at least 40% higher than the 20-period volume moving average.
- Strategic Confluence: For traders navigating the live market feeds at MBroker, ensuring that your pivot lines align with major historical support/resistance zones on higher timeframes dramatically increases your setup’s win rate.
Once you have mastered the art of signal confirmation, you can deploy these elements into a highly profitable day-trading system.
Intraday trades using pivot points strategy
Intraday trades using pivot points strategy provides day traders with an objective, mechanical playbook that removes all emotional bias from the execution cycle.

These levels are recalculated every single day, they are natively designed for short-term market environments where positions are opened and closed within the same 24-hour window. By using these lines as predefined targets and stop-loss boundaries, day traders can easily secure high risk-reward setups without holding positions overnight.
Why are pivot points suitable for intraday trades?
Pivots are exceptionally suited for intraday trading because they address the biggest challenge day traders face: identifying intra-day support and resistance where historical structural data does not exist. When an asset is trading in a clean, daily range, old swing highs and lows are often too far away to guide a 15-minute chart. Pivot points solve this problem by generating fresh, actionable, and mathematically precise zones every morning at 00:00 GMT, giving day traders an unfair advantage.
Let’s break down the exact execution sequence to run this strategy in a live environment.
How to trade pivot points intraday step by step?
Follow this systematic, 6-step roadmap to execute intraday setups with professional discipline:
- Step 1: Identify the Daily Bias: At the start of the trading session, look at where the current price sits relative to the central Pivot Point (PP). If it’s above, focus exclusively on buys; if below, look only for shorts.
- Step 2: Wait for Price Interaction: Monitor your chosen asset on a 15-minute chart as it approaches a key level, such as the S1 support or R1 resistance line.
- Step 3: Look for Candlestick Confirmation: Wait for the 15-minute candle to explicitly reject the level via a long wick or an engulfing body, validating that institutional liquidity is holding the line.
- Step 4: Execute the Entry: Open your position immediately upon the close of the rejection candle.
- Step 5: Position the Stop Loss: For a buy trade at S1, place your Stop Loss exactly 5–10 pips below the S2 line to protect your capital from minor liquidity sweeps.
- Step 6: Set the Take Profit Target: Set your profit target at the next structural line in the sequence. If buying at S1, your first target is the central PP, and your ultimate target is R1.
To execute this strategy smoothly, you must move away from manual charting and automate the calculations directly inside your trading terminal.
Pivot points MT4 settings and indicator setup
Configuring your pivot points MT4 settings correctly is the final operational step to ensuring your trading terminal mirrors the exact data seen by institutional market makers.
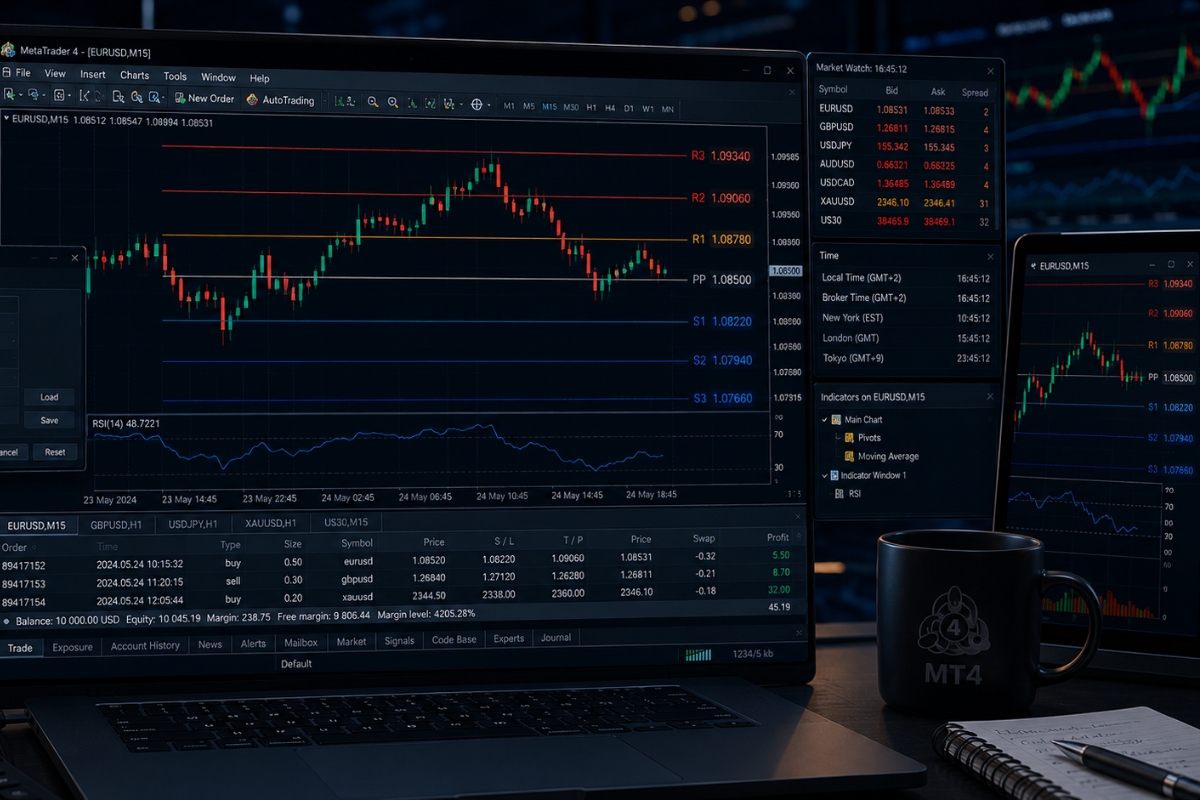
While MetaTrader 4 remains the most popular platform for retail Forex trading, it does not include a custom pivot indicator by default. Fortunately, installing a professional-grade indicator and adjusting its parameters according to your specific time zone allows for seamless, real-time automation of these calculations.
How to install pivot points indicator on MT4?
To add this tool to your terminal, execute the following technical steps:
- Download the File: Secure a trusted .mq4 or .ex4 pivot point indicator file from a verified repository.
- Open the Data Folder: Inside MT4, click on File in the top menu and select Open Data Folder.
- Navigate to Indicators: Open the MQL4 folder, double-click on Indicators, and paste your downloaded file here.
- Refresh the Terminal: Restart your MT4 platform or right-click Indicators in the Navigator window and press Refresh.
- Apply to Chart: Drag and drop the indicator onto your active chart and ensure “Allow DLL imports” is checked in the settings tab.
Once the indicator is successfully active in your workspace, fine-tuning the internal input variables is mandatory to ensure data accuracy.
What settings work best for pivot points in MT4?
The absolute best settings for this indicator depend heavily on your data source and server time zone. For optimal performance, configure your inputs using the following elite parameters:
- Calculation Mode: Set to Classic / Floor for standard retail Forex, or change to Camarilla if you are a high-frequency scalper.
- Timeframe Reference: Set explicitly to Daily (D1) to ensure your intra-day charts pull data from the full 24-hour cycle.
- Server Time Sync: Ensure your indicator calculates using a GMT+2 or GMT+3 (New York Close) server time. This is standard configuration among institutional liquidity providers and is the default framework recommended on the MBroker platform to prevent the generation of erratic “weekend candles.”
In conclusion, Pivot Points remain an irreplaceable component of a professional trading framework, transforming raw historical data into clear, forward-looking support and resistance targets. By pairing these levels with strict candlestick confirmation, disciplined intraday risk parameters, and properly synchronized MT4 configurations, you can execute trades with complete structural confidence.

Thoren Vextal is a specialist in XM trading guides, offering practical insights and real-market experience to help traders improve their strategies and trading performance. Email: [email protected]